EUR/USD
Analysis:
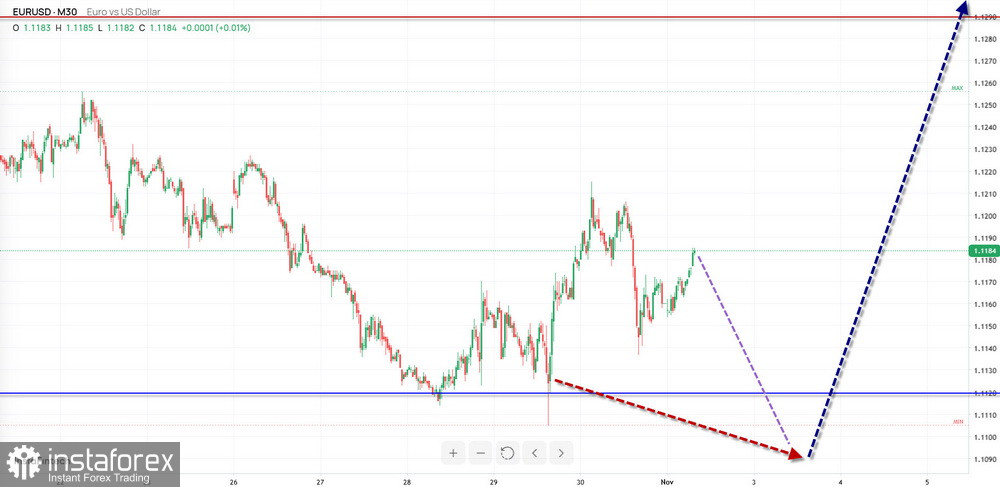
In the short term, the European currency's major pair is following a downward wave structure that began in mid-August of this year. A corrective pattern has been developing within this structure over the past month, and its final segment is still missing. The wave extremes form a shifting flat pattern on the chart.
Forecast:
Over the coming week, the euro is expected to trade predominantly sideways. A decline and brief pressure on support are possible over the next couple of days. A reversal and the beginning of a price advance may follow, potentially extending to the projected resistance zone. Volatility is expected to increase in the second half of the week.
Potential Reversal Zones
Resistance:
Support:
Recommendations:
- Buying: May become the primary trading strategy once confirmed signals appear near the support zone.
- Selling: Possible for intraday trading, but with limited potential.
USD/JPY
Analysis:
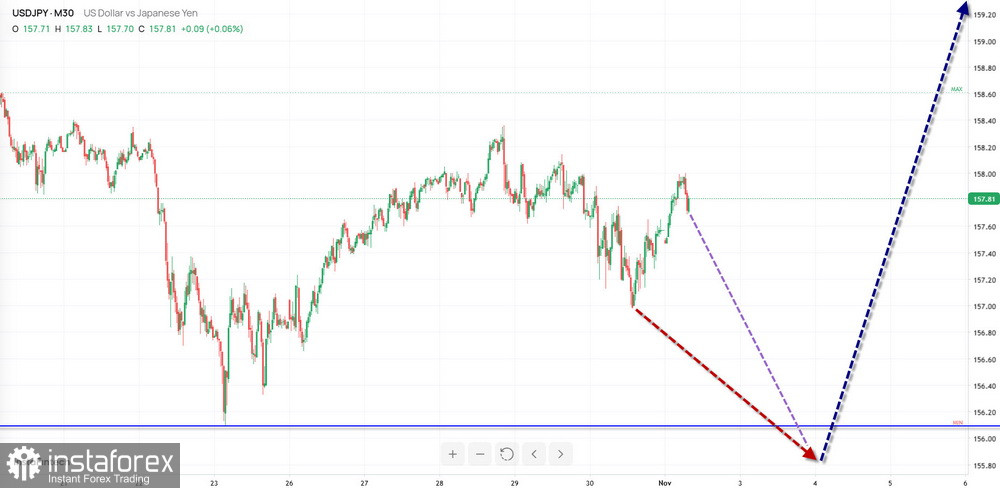
On the chart of the Japanese yen's major pair, an upward wave that began on August 3 is developing in the short term. An intermediate correction is forming within its final segment (C), which remains incomplete. Prices are trading within a cluster of potential reversal zones across different time frames. The upward move that began on October 23 has reversal potential.
Forecast:
Over the next few days, the price is expected to continue moving predominantly sideways, with a downward bias. The decline may continue until the pair reaches the support zone. After that, the probability of a directional reversal and the beginning of an advance will increase. The projected resistance area represents the most likely upper boundary of the pair's weekly trading range.
Potential Reversal Zones
Resistance:
Support:
Recommendations:
- Buying: May become possible once the trader's trading systems generate confirmed reversal signals near the reversal zone.
- Selling: Risky, with limited potential.
GBP/JPY
Analysis:
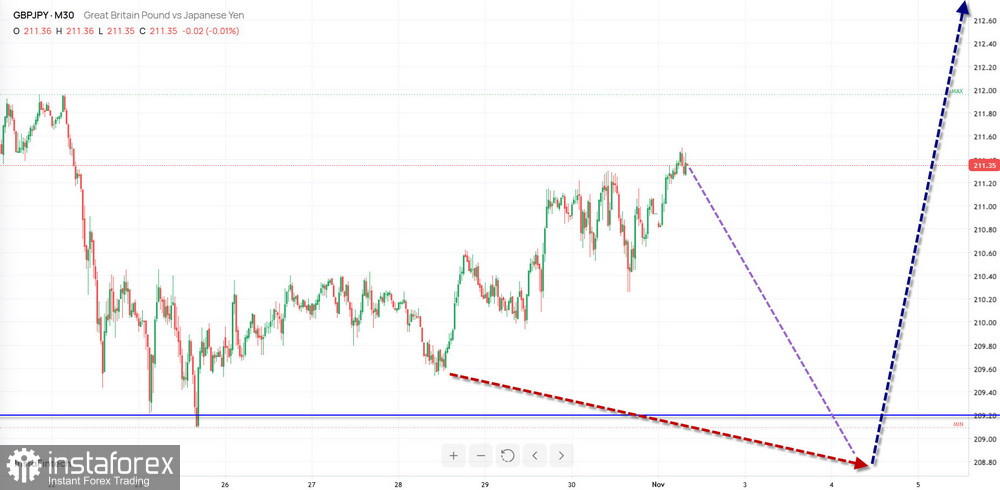
The upward wave that has dominated the Japanese yen pair against the British pound since early August has pushed prices toward a strong resistance zone on the weekly time frame. An intermediate correction is developing within the final part of this wave and remains incomplete.
Forecast:
During the first half of the coming week, the pair is expected to trade sideways with a downward bias. The decline is likely to remain within the support zone. Thereafter, activity may increase, and the pair may begin advancing toward the projected resistance levels. The start of this move may coincide with the release of important economic data.
Potential Reversal Zones
Resistance:
Support:
Recommendations:
- Selling: Offers limited potential and may be risky. Reducing position size would be safer.
- Buying: May become relevant once trading systems generate reversal signals near the support zone.
USD/CAD
Analysis:
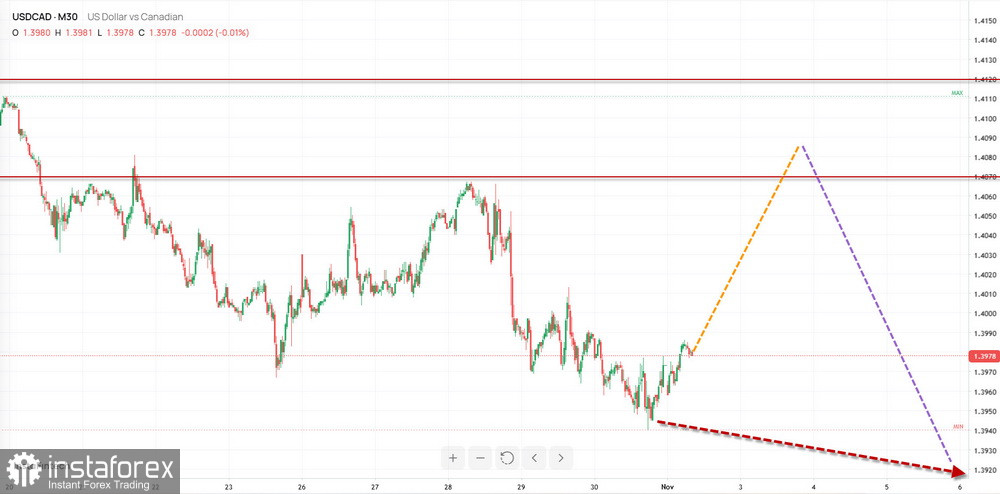
An upward wave pattern has been developing in the US dollar against the Canadian dollar since August 21. The middle, corrective part of this structure has entered its final stage. Prices are approaching the upper boundary of a potential reversal zone on the higher time frame. No signals of an imminent reversal are visible on the chart at the time of analysis.
Forecast:
At the beginning of the coming week, the pair is expected to trade sideways with an upward bias. An upward retracement may continue until prices reach the boundaries of the resistance zone. Closer to the weekend, a reversal and a resumption of the downward move may develop. A breakout beyond the range defined by the opposing zones during the week is unlikely.
Potential Reversal Zones
Resistance:
Support:
Recommendations:
- Selling: May be considered with reduced position sizes after the trader's trading systems generate appropriate signals near the support zone.
- Buying: Risky due to limited potential.
NZD/USD
Brief Analysis:
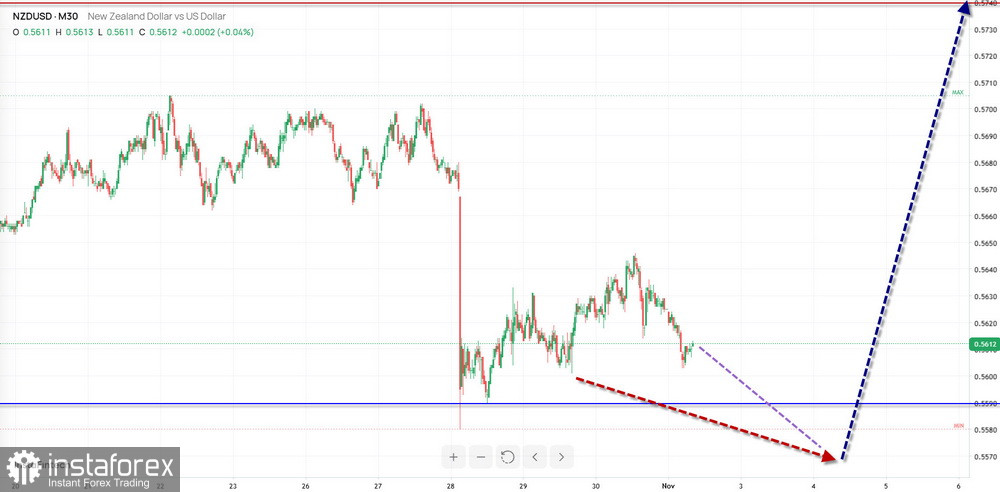
The downward wave in the New Zealand dollar's major pair, which remains incomplete, began on August 21. A countertrend correction in the form of a shifting flat pattern has been developing within this structure since early October. At the time of analysis, the wave does not appear complete. The price is near the upper boundary of a potential reversal zone on the daily time frame.
Weekly Forecast:
At the beginning of the coming week, the pair is expected to continue moving downward until it reaches the support zone. After that, price fluctuations may shift into a sideways range. Closer to the weekend, volatility is likely to increase, potentially leading to a reversal and the beginning of an upward move. When the direction changes, a brief break below the lower boundary of the projected support zone cannot be ruled out.
Potential Reversal Zones
Resistance:
Support:
Recommendations:
- Buying: Premature until confirmed reversal signals appear.
- Selling: Possible with small position sizes during individual trading sessions, but with limited potential.
Gold
Analysis:
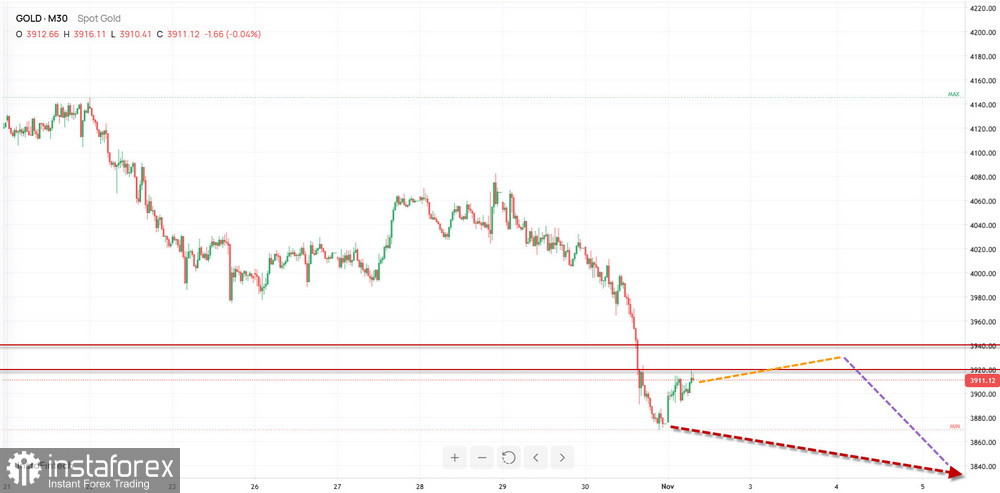
The downward trend that has dominated the gold chart since the beginning of this year has brought the price into an area where potential reversal zones across different time frames converge. The trend wave does not appear complete. Its final segment began last week and remains unfinished.
Forecast:
At the beginning of the coming week, gold is expected to continue trading sideways. An upward move is possible, but it is likely to remain within the projected resistance boundaries. A resumption of the downward trend may follow. A breakout beyond the projected zones during the week is unlikely.
Potential Reversal Zones
Resistance:
Support:
Recommendations:
- Selling: May become relevant once confirmed reversal signals appear in the resistance zone.
- Buying: Offers limited potential and is unlikely to extend beyond resistance. Reducing position size would be safer.
Explanatory Notes
In Simplified Wave Analysis (SWA), all waves consist of three parts (A-B-C). The latest incomplete wave is analyzed on each time frame. Expected price movements are shown with dashed lines.
Important: The wave algorithm does not take the duration of price movements into account.