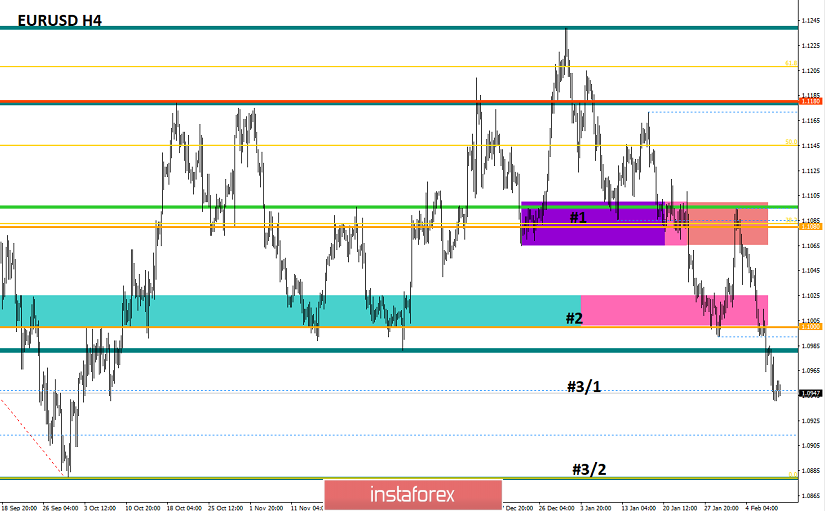
From a comprehensive analysis, we see the price-fixing at the third stage of 1.0950, which can be considered a success, and now about the details. The downward movement has been held on the market for more than five weeks. During this time, we managed to see the price return to the area of October last year. Steps #1 (1.1080) and #2 (1.1000) already passed the quote, and the recent price-fixing at the stage #3/1 (1.0950) reflected the production of 82% relative to the entire value of the oblong correction, and this is the first time. Against this background, experts spoke with one voice about the fact that the minimum of last year, reflecting the step #3/2 (1.0879), will be passed soon, and historical lows are already considered as real prospects. This development is real, however, we should not unnecessarily catch up with FOMO, since, for example, we will go down to the level of 1.0879 and even lock in below. After that, we are immediately faced with an extremely strong psychological range of 1.0000/1.0500, which speculators are afraid of. That is, no one rules out a repeat of the pattern of 2015 and the beginning of 2007. Believe me, speculators will behave in the same way due to the high risk of a rebound. We still have a long way to go before such reflections. First, let the quote go to the area of 1.0880, and then it will be visible. Perhaps we will see significant support for the information background.
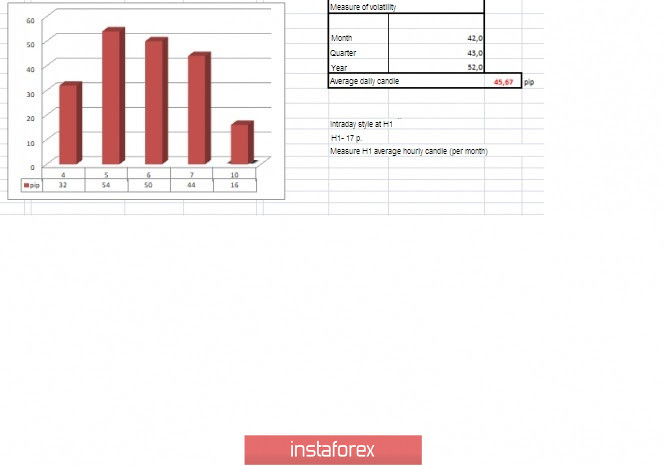
In terms of volatility, we see stable indicators that are close to the daily average, which indicates a healthy tact and market sentiment. In this case, a stable tact can give more profit than a local jump. Do not forget about this.
Analyzing the Friday every minute, we see almost stable downward interest, where both impulses and inertia were present. The most remarkable time was the period of transition of the European session to the American one, where we saw ups/downs against the background of the news. The subsequent oscillation was again in terms of downward inertia.
As discussed in the previous review, traders have been actively working on the decline since the price was fixed below 1.0980. Step #3/1 played the role of regrouping trading forces, where you can fix the profit for the subsequent re-entry.
Looking at the trading chart in general terms (the daily period), we see the recovery process that has been waiting for so long. Let me remind you that the oblong correction has been maintained on the market for as long as 4.5 months. This value is comparable to the medium-term trend. This kind of hovering was last recorded during the correction from November 2018, however, we did not see such a large scale, perhaps the background from historical lows has affected the correction.
Friday's news background had a report from the United States Department of Labor, where the expectations that came to the US from the ADP report coincided and we saw a significant increase in new jobs (225,000) compared to the previous period (147,000). In turn, the unemployment rate accelerated from 3.5% to 3.6%, but the share of the labor force in the total population gave a greater increase from 63.2% to 63.4%. At the same time, we should not forget that the stimulus for the growth of the US currency came to us not only from the States but also from Europe. So, at the beginning of the European session, we had extremely weak data on industrial production, where Germany recorded an acceleration of the decline from -2.5% to -6.8%. But in France, the growth of industrial production changed from a growth of 0.9% to a decline to -3.0%. Now, we understand that the dollar was the most profitable asset.
In terms of the general information background, we did not have something supernatural. The noise of the coronavirus, as well as the upcoming negotiations between England and Brussels, remains in the minds of market participants. The only thing I want to add to this section is the range of events of the current week. So, on Tuesday and Wednesday, Federal Reserve Chairman Jerome Powell will deliver a semi-annual report to the US Congress, which is worth looking at. On Thursday, data on inflation in the United States will be published, and this parameter is key in determining monetary policy and the Fed's rhetoric.
Today, in terms of the economic calendar, there is silence on all fronts, thus work is being done on the analysis of the external background, as well as technical factors.
Further development
Analyzing the current trading chart, we see a distinct accumulation in the area of the step #3/1 (1.0950), where the quote forms an extremely narrow amplitude oscillation. In fact, we see how much sellers are stuck in the market, which does not give the opportunity to roll back even at the moment of regrouping of trading forces, which would be a good step in this case. This kind of retention suggests that recovery theory is going through better times.
Detailing the available time interval per minute, we see a fluctuation within the range of 1.0941/1.0957, where the value of 1.0950 is the main one in this amplitude.
In terms of the emotional mood of market participants, we see a strong influx of traders, which was not observed before, probably due to a significant recovery of the quote relative to the oblong correction.
In turn, traders carefully analyze the behavior of the quote at the third stage, since there is a chance of further progress.
It is likely to assume that holding the downward trend and fixing the price below 1.0940 will lead to a new influx of volumes that will be directed to the final stage #3/2 (1.0880).
Based on the above information, we will output trading recommendations:
- Buy positions will be considered if the price is fixed higher than 1.0960, with the prospect of a move to 1.0980-1.1000.
- Sell positions are held towards 1.0880. If we have no deals, it makes sense to consider the point of 1.0940, fixing on H4.
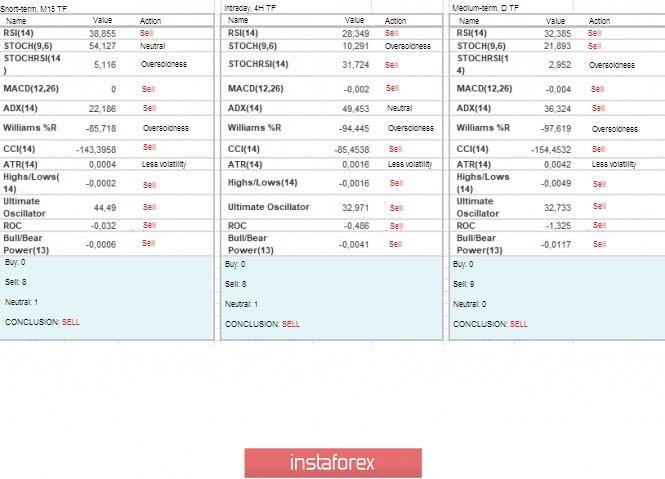
Indicator analysis
Analyzing different sectors of timeframes (TF), we see that the indicators of technical instruments unanimously signal sales, which confirms the general background of the market.
Volatility for the week / Volatility Measurement: Month; Quarter; Year.
The volatility measurement reflects the average daily fluctuation, based on the calculation for the Month / Quarter / Year.
(February 10 was based on the time of publication of the article)
The volatility of the current time is 16 points, which is extremely low value in terms of dynamics. It is likely to assume that the acceleration in the event of an exit from accumulation is still possible, but it will be expressed within the average indicator.
Key levels
Resistance zones: 1.1000***; 1.1080**; 1.1180; 1.1300**; 1.1450; 1.1550; 1.1650*; 1.1720**; 1.1850**; 1.2100.
Support zones: 1.0900/1.0950**;1.0850**; 1.0500***; 1.0350**; 1.0000***.
* Periodic level
** Range level
*** Psychological level
***** The article is based on the principle of conducting a transaction, with daily adjustments.