Outlook on October 2:
Analytical overview of major pairs on the H1 scale:
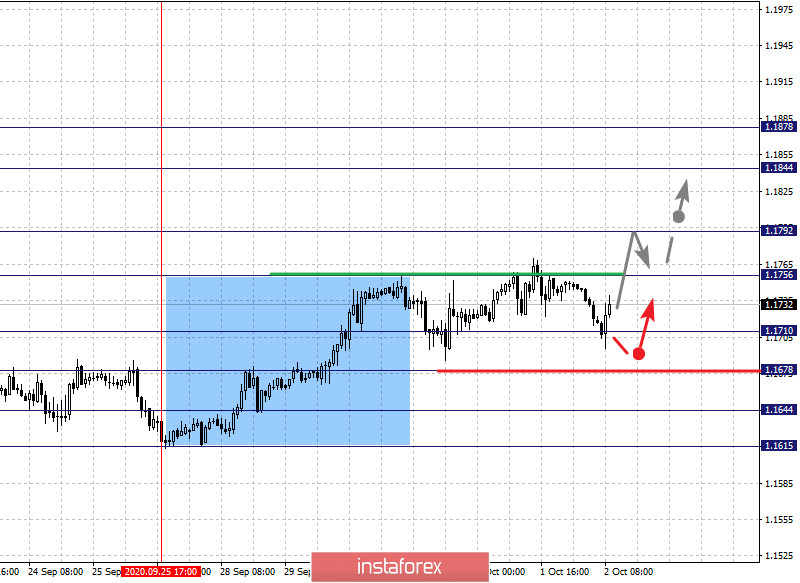
The key levels for the euro/dollar pair on the H1 chart are 1.1878, 1.1844, 1.1792, 1.1756, 1.1710, 1.1677, 1.1644 and 1.1615. The price forms strong initial conditions for the upward cycle of September 25 here. Now, a short-term upward movement is expected in the range of 1.1756 - 1.1792 and given that the last value breaks down, it will lead to a strong movement. The target is 1.1844. For the potential value for the top, we consider the level of 1.1878. Upon reaching which, we expect consolidation and downward pullback.
A short-term downward movement is possible in the range of 1.1710 - 1.1677. In case that the last value breaks down, it will lead to a deep correction. The target is 1.1644, which is a key support for the top.
The main trend is the formation of potential for the top from September 25
Trading recommendations:
Buy: 1.1756 Take profit: 1.1790
Buy: 1.1794 Take profit: 1.1844
Sell: 1.1710 Take profit: 1.1678
Sell: 1.1675 Take profit: 1.1645
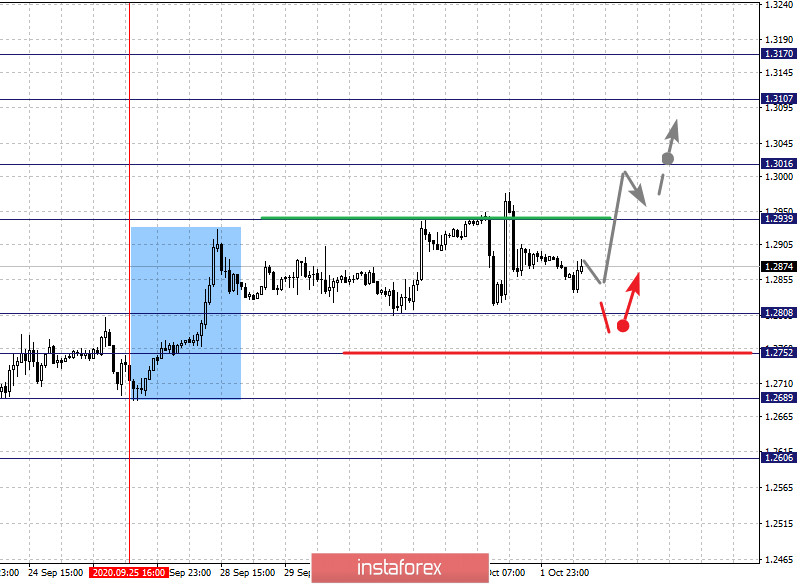
The key levels for the pound/dollar pair are 1.3170, 1.3107, 1.3016, 1.2939, 1.2808, 1.2752, 1.2689 and 1.2606. Here, a strong initial condition for the September 25 high is expected to form. On the other hand, the growth is expected to continue after breaking through the level of 1.2939. In this case, the target is 1.3016 and price consolidation is near this level. If the indicated target breaks down, it should be accompanied by a strong increase. The next target will be 1.3107. We consider it as a potential value for the top. Upon reaching which, we expect consolidation and downward pullback.
A short-term downward movement is expected in the range of 1.2808 - 1.2752. If the last value breaks down, it will lead to the cancellation of the upward structure from September 25. The first target is 1.2689. In the meantime, we consider the level 1.2606 as a potential value for the bottom.
The main trend is the formation of initial conditions for the top of September 25
Trading recommendations:
Buy: 1.2940 Take profit: 1.3014
Buy: 1.3017 Take profit: 1.3105
Sell: 1.2808 Take profit: 1.2754
Sell: 1.2750 Take profit: 1.2690
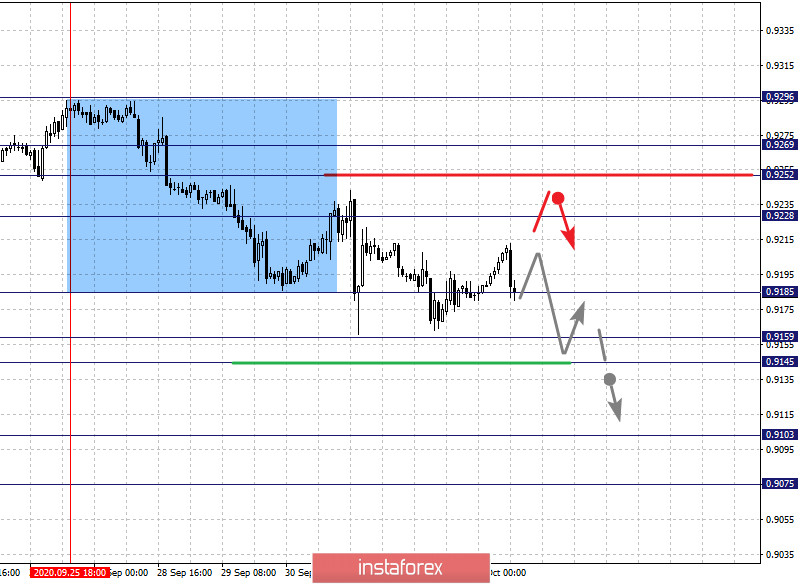
The key levels for the dollar/franc pair are 0.9269, 0.9252, 0.9228, 0.9185, 0.9159, 0.9145, 0.9103 and 0.9075. The formation of the downward trend pattern from September 25 is being followed here. The decline is expected to continue after breaking through the level of 0.9185. In this case, the target is 0.9159 and there is consolidation near this level. On the other hand, the price passing the noise range 0.9159 - 0.9145 will lead to the development of a strong decline. Here,the target is 0.9103. For the potential value for the bottom, we consider the level of 0.9075. Upon reaching which, we expect an upward pullback.
In turn, leaving into a correction is expected after the breakdown of 0.9228. The target here is 0.9252. There is a short-term upward movement, as well as consolidation in the range of 0.9252 - 0.9269. If the last value breaks down, it will lead to the formation of an upward structure. The potential target will be the level of 0.9296.
The main trend is the formation of a descending structure from September 25
Trading recommendations:
Buy : 0.9228 Take profit: 0.9250
Buy : 0.9253 Take profit: 0.9269
Sell: 0.9185 Take profit: 0.9160
Sell: 0.9145 Take profit: 0.9105
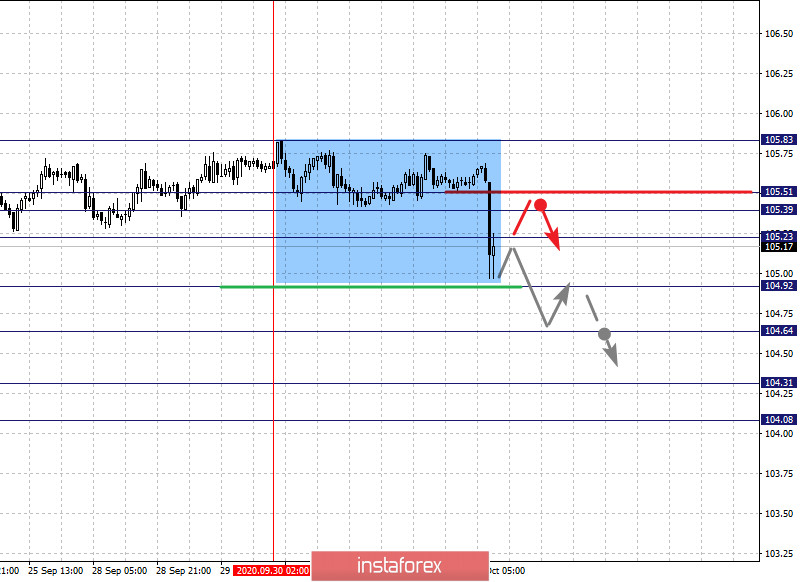
The key levels for the dollar/yen are 105.83, 105.51, 105.39, 105.23, 104.92, 104.64, 104.31 and 104.08. Here, we are following the formation of the downward trend on September 30. The decline is expected to continue after breaking through the level of 104.92. In this case, the target is 104.64 and there is consolidation near this level. The breakdown of the indicated target will lead to the development of a strong movement. Our next goal will be 104.31. For the potential value for the bottom, we consider the level 104.08. Upon reaching which, we expect consolidation and upward pullback.
A short-term upward movement is expected in the range of 105.23 - 105.39. Meanwhile, the range of 105.39 - 105.51 is the key support for the downward structure and the price passing this range will lead to the formation of an upward structure. The potential target here is 105.83.
The main trend is the descending structure from September 30
Trading recommendations:
Buy: 105.23 Take profit: 105.39
Buy : 105.51 Take profit: 105.80
Sell: 104.90 Take profit: 104.65
Sell: 104.62 Take profit: 104.31
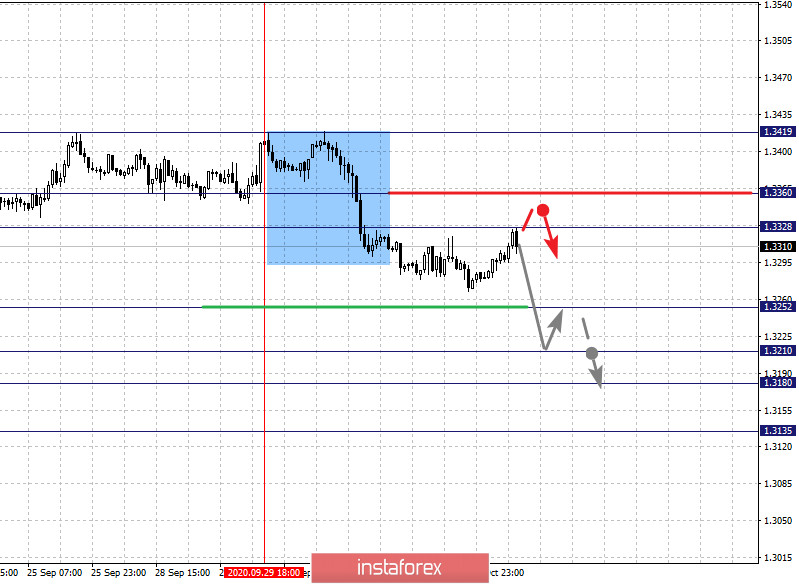
The key levels for the USD/CAD pair are 1.3419, 1.3360, 1.3328, 1.3252, 1.3210, 1.3180 and 1.3135. The price forms a descending structure from September 29. The development of which is expected after the breakdown of 1.3252. In this case, the target is 1.3210. Meanwhile, price consolidation is in the range of 1.3210 - 1.3180. We consider the level 1.3135 as a potential value for the downward movement. It is likely to move to this level after the breakdown of 1.3180.
A short-term upward movement is possible in the range of 1.3328 - 1.3360. Breaking through the last value will encourage the formation of an initial structure for an upward cycle. The target here is 1.3419.
The main trend is the formation of a descending structure from September 29
Trading recommendations:
Buy: 1.3328 Take profit: 1.3360
Buy : 1.3362 Take profit: 1.3417
Sell: 1.3252 Take profit: 1.3210
Sell: 1.3180 Take profit: 1.3135
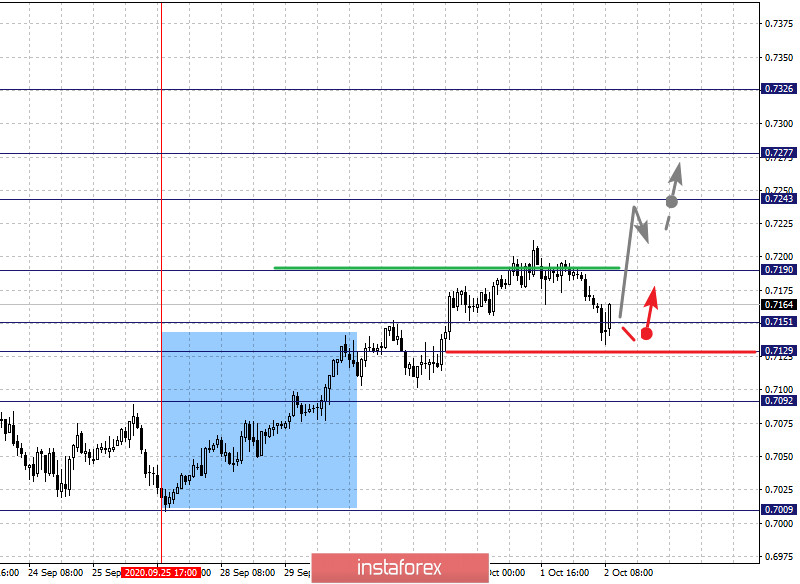
The key levels for the AUD/USD pair are 0.7326, 0.7277, 0.7243, 0.7190, 0.7151, 0.7129 and 0.7092. Here we are following the upward structure from September 25. Now, the upward movement is expected to continue after the breakdown of 0.7190. In this case, the target is 0.7243. On the other hand, there is a short-term upward movement and consolidation in the range of 0.7243 - 0.7277. As a potential value for the top, we consider the level of 0.7326; upon reaching which, we expect a downward pullback.
A short-term downward movement is expected in the range of 0.7151 - 0.7129. If the last value breaks down, it will lead to a deep correction. Here, the target is 0.7092, which is the key support for the top.
The main trend is the upward structure from September 25
Trading recommendations:
Buy: 0.7192 Take profit: 0.7240
Buy: 0.7244 Take profit: 0.7275
Sell : 0.7151 Take profit : 0.7130
Sell: 0.7127 Take profit: 0.7092
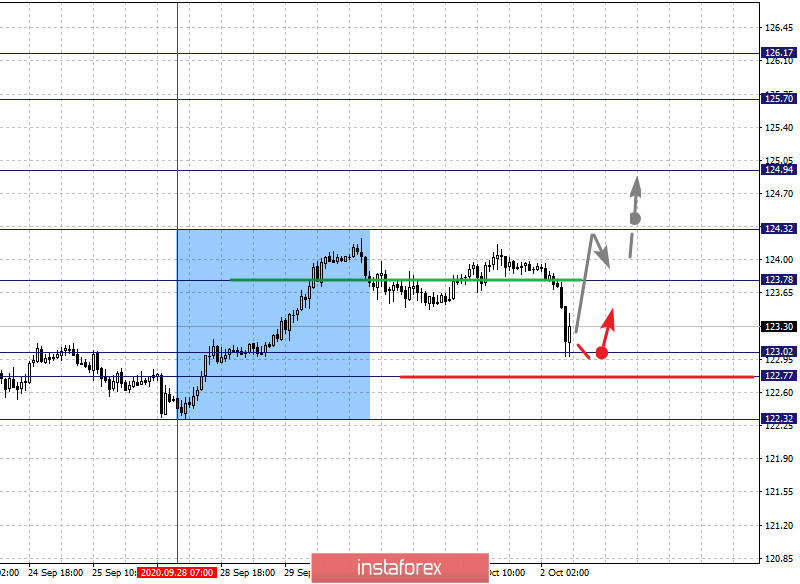
The key levels for the euro/yen pair are 126.17, 125.70, 124.94, 124.32, 123.78, 123.02, 122.77 and 122.32. The formation of the upward structure from September 28 is being followed here. Growth, in turn, is expected after the breakdown of 123.78. In this case, the first target is 124.32, breaking through this level will start the development of the main trend. Here, the target is 124.94 and there is consolidation near this level. If the level of 124.95 breaks down, it will lead to a strong rise. Our next target will be 125.70. As a potential value for the top, we consider the level of 126.17; upon reaching this level, consolidation and downward pullback are expected.
The key support for the top is the range of 123.02 - 122.77 and the price passing this level will lead to the development of a downward structure. In this case, the first potential target is 122.32.
The main trend is the upward structure from September 28, the stage of correction
Trading recommendations:
Buy: 123.78 Take profit: 124.30
Buy: 124.34 Take profit: 124.92
Sell: 122.75 Take profit: 122.34
Sell: Take profit:
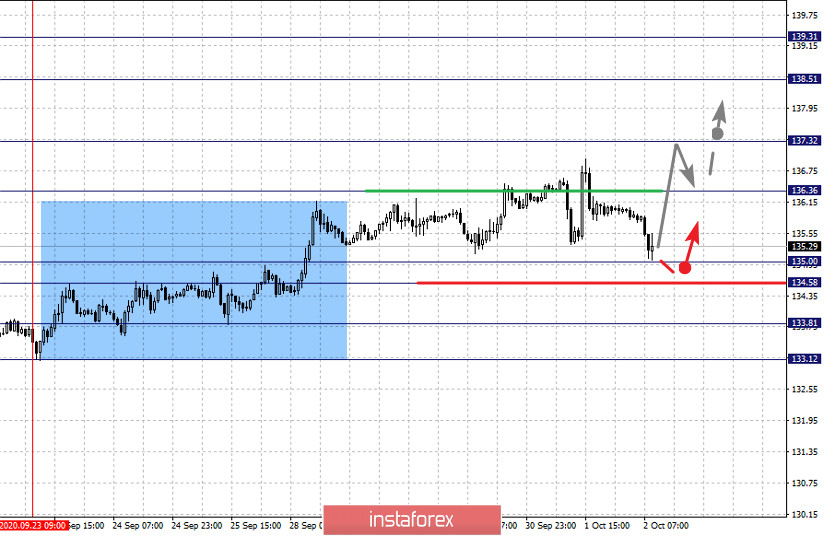
The key levels for the pound/yen pair are 139.31, 138.51, 137.32, 136.36, 135.00, 134.58, 133.81 and 133.12. Here, we regard the rising structure of September 23 as a medium-term. The growth of the pair is expected to continue after breaking through the level of 136.36. In this case, the target is 137.32 and there is consolidation around this level. Now, if the level of 137.34 breaks down, it should be accompanied by a strong upward movement, The target here is 138.51. For the potential value for the top, we consider the level of 139.31, from which a downward pullback is expected.
A short-term downward movement is expected in the range of 135.00 - 134.58. If the last value breaks down, it will encourage the development of a downward structure. Here, the first potential target is 133.81.
The main trend is the medium-term upward structure of September 23
Trading recommendations:
Buy: 136.36 Take profit: 137.30
Buy: 137.35 Take profit: 138.50
Sell: 135.00 Take profit: 134.60
Sell: 134.52 Take profit: 133.85