Overview of trade on Friday
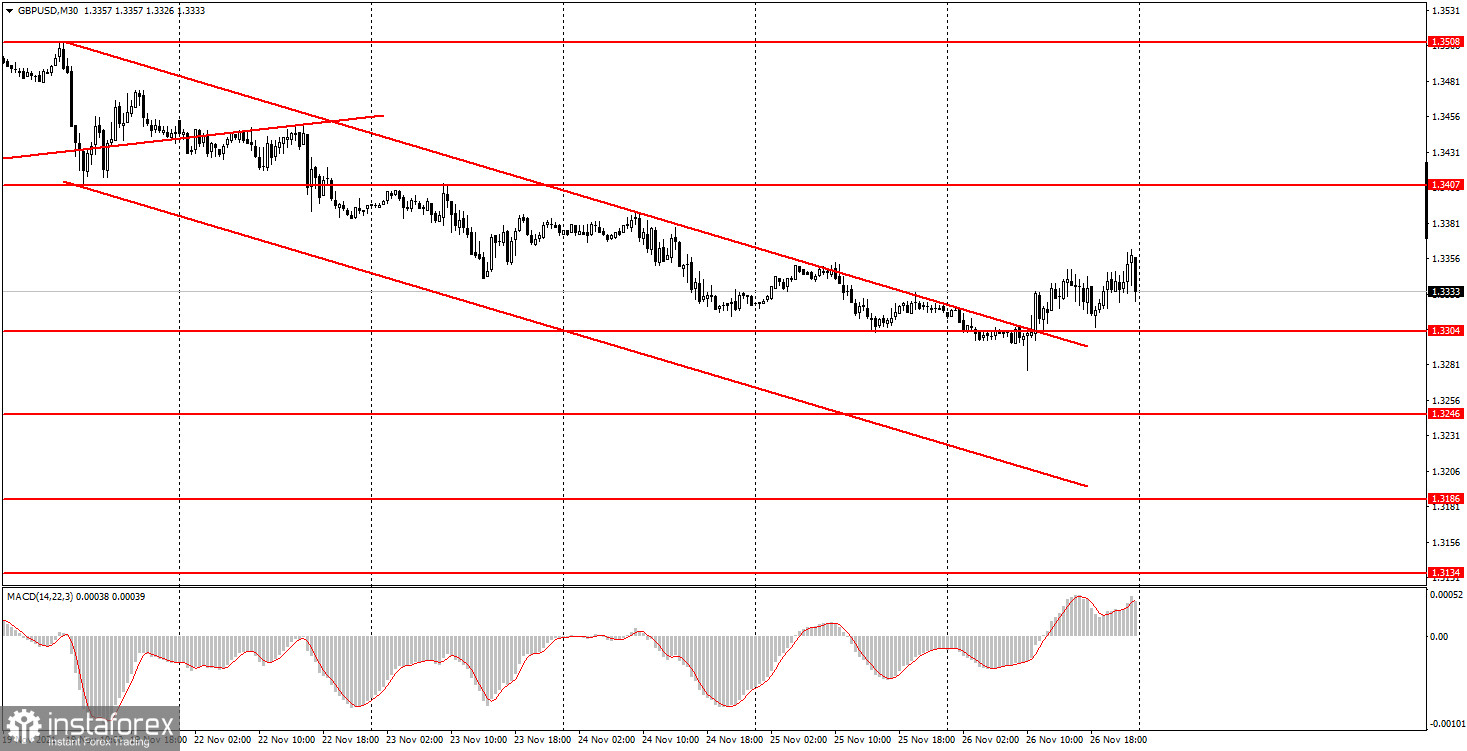
30-minute chart of GBP/USD
On November 26, GBP/USD was another currency pair that reversed its bias upwards on the 30-minute chart because it settled above the downward channel. Thus, the sterling is expected to regain footing for a while, though its growth was much weaker than the euro's rise. It is common knowledge that GBP has been always more volatile. That's why its weak moves come as a surprise. We can suppose that traders are unwilling to buy GBP due to troublesome fundamental background in the UK. London is still doing battle with the EU authorities regarding Brexit and the Northern Ireland protocol. Besides, London still cannot settle the conflict with France on fisheries. Meanwhile, Scotland has announced its plans to conduct a referendum on independence in the two coming years. All in all, perhaps traders do not see any reasons to buy GBP. This week, we will be able to check whether our suggestion is true. What we can affirm at present is that GBP has reversed a bias upwards. Once GBP/USD crossed the upward trend line, this price move could be understood as a buy signal, though we could gain just modest profit.
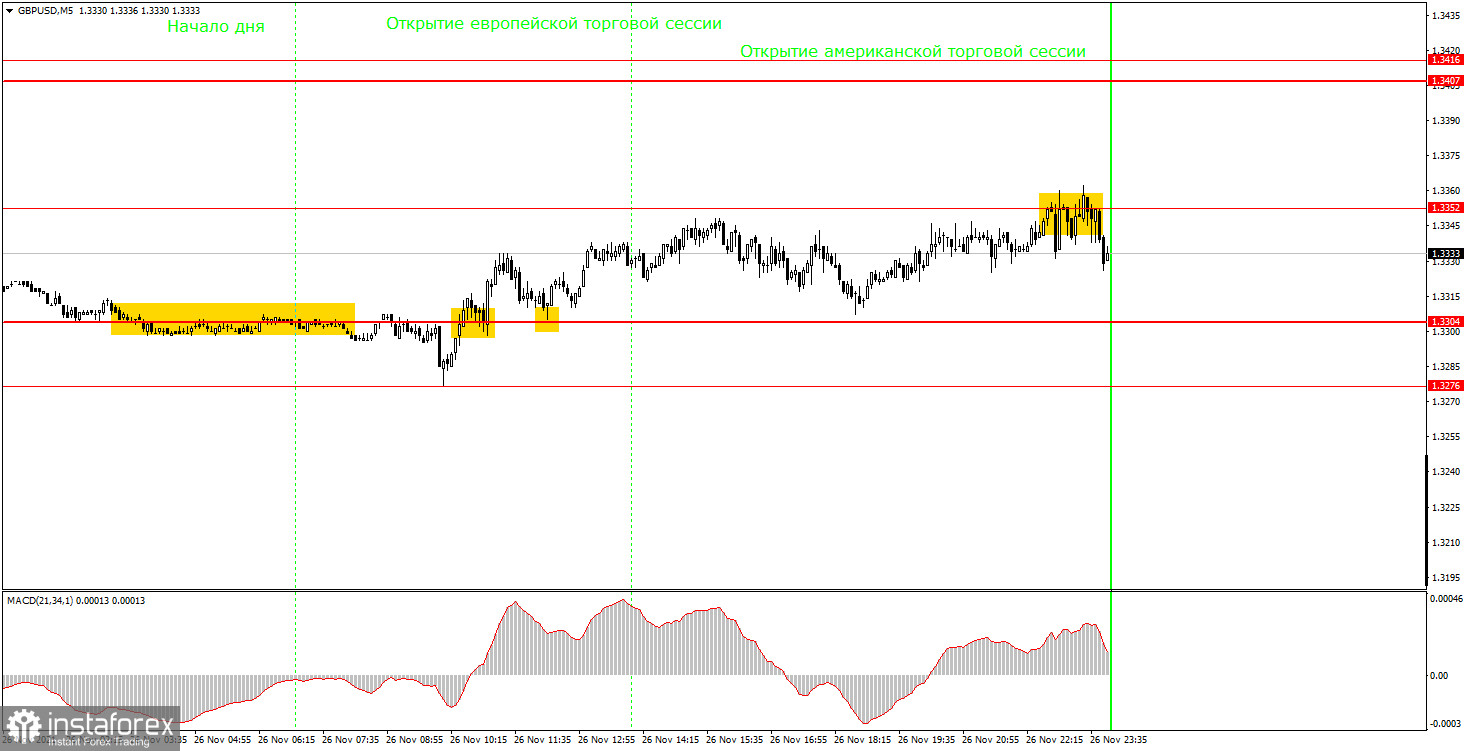
5-minute chart of GBP/USD
According to the 5-minute chart, GBP/USD is making odd moves. The currency pair was trading between 1.3304 and 1.3352 for the most part of Friday. So, we can assume that the pair was trading mainly flat without a clear-cut trend. Nevertheless, we could spot a minor upward move. Let's try to answer how we could work out all technical signals and moves. In fact, it was complicated to plan any positions amid a tricky move.
For a start, the first signal was forming for a few hours and ended up as a fake one. In the beginning of the European session, the currency pair retreated off 1.3304 and opening short positions was appropriate at that moment. However, the price did not go down too low. Later on, the price reserved sharply upwards and settled above 1.3304. It was nice that after a sell signal, the price went down exactly 20 pips that enabled us to set a stop loss at a breakeven. Then, we should have bought GBP/USD following a buy signal but things went wrong. The price went upwards 37 pips, so 3 pips were missing before profit taking. Besides, 4 pips were left to work out 1.3352. As a result, the currency pair declined back to 1.3304 that triggered a stop loss at a breakeven. At the same time, the level of 1.3304 was not worked out, so a new buy signal failed. It's a shame because that signal could have brought some profit because the price touched 1.3352 for the second time. All I can say, Friday was not a lucky day. Sadly, it happens sometimes.
How to trade GBP/USD on Monday
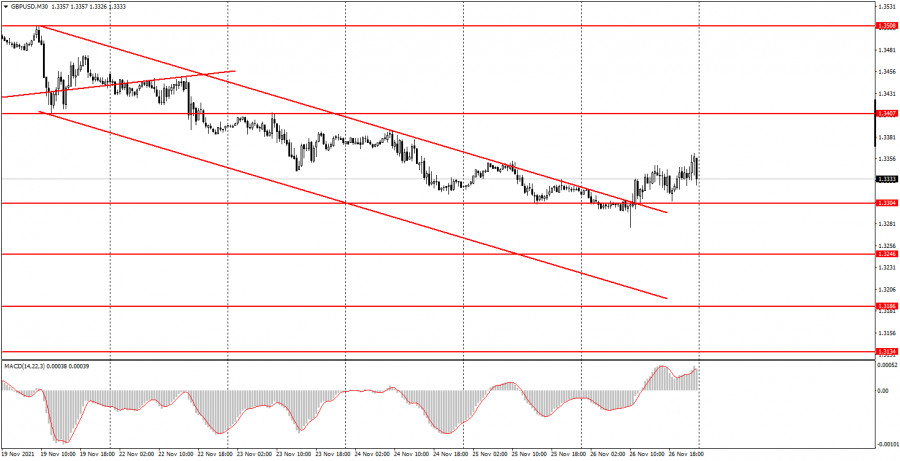
At the moment, the downward move has been cancelled again on the 30-minute chart. However, the beginning of a new uptrend is not confident. Hence, we cannot rely on a strong uptrend for a while. Looking back, a downtrend was cancelled on November 17 but it revived shortly after. The important levels to watch on the 5-minute chart are the following: 1.3276, 1.3304, 1.3352, 1.3407 – 1.3416. I would recommend trading these levels on Monday. The price could rebound from them or cross them. There are no important lower levels as the price have not dropped lower for more than a year. As usual, a take profit should be set 40-50 pips away. On the 5-minute chart, we could set all nearest levels as targets. In this case, we should take profit depending on the movement's extent. If the price moves in the right direction, it would make sense to set a stop loss at a breakeven. The economic calendar is empty for the US and the UK on November 29. So, the sterling is expected to carry on with its feeble attempts to grow against the US dollar.
Basic rules of trading system:
1)The signal's strength is assessed through the time that is needed to form a signal (a bounce or overcoming a level). The less time was needed, the stronger the signal was formed.
2)If two or more positions were opened next to any level on the grounds of fake signals (a take profit was not triggered or the price did not reach the nearest target), all following signals from that level should be neglected.
3)Trading flat, any currency pair commonly generates plenty of fake signals or no signals are formed at all. Anyway, with the first signs of a flat market, it would be better to stop trading.
4)Trading positions should be opened in the interval between the beginning of the European session until the middle of the American session when all positions have to be closed manually.
5)On the 30-minute chart, it makes sense to trade according to MACD signals only on condition of good volatility and a clear-cut trend which are confirmed by a trend line or a trend channel.
6)If the two levels are too close to each other (5-15 pips), they should be considered support and resistance.
What's on the chart:
Support and Resistance levels are the levels that are targets when opening buy or sell orders. Take Profit levels can be placed near them.
Red lines are channels or trend lines that display the current trend and show which direction it is preferable to trade now.
MACD indicator is represented by a histogram and a signal line. When they are crossed, this signals a market entry. It is recommended for use in combination with trend patterns (channels, trend lines).
Important speeches and reports in the economic calendar can greatly influence the movement of the currency pair. Therefore, during their release, it is recommended to trade as carefully as possible or exit the market in order to avoid a sharp price reversal against the previous movement.