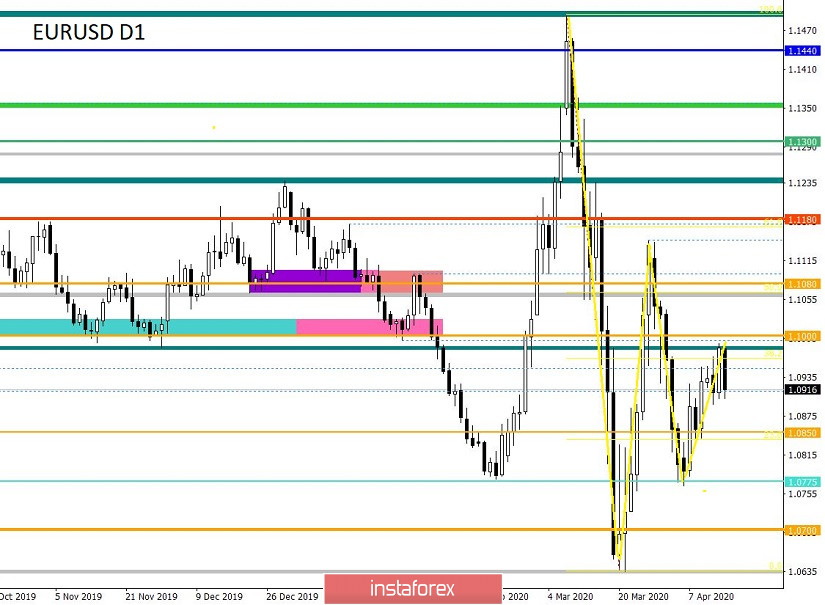
From a comprehensive analysis perspective, we see a local rapprochement with the psychological level of 1.1000, where the quotes slowed down and turned around. The sluggish fluctuation of the closing last week was left behind, the market is gradually gaining momentum, local outbursts arise, and behind these are speculative interests. Now, considering the trading chart, we see that the quotes no longer tend to accumulate, but forms a still local movement, during which the breakdown of Monday's maximum is 1.0967, and then converges with the level of 1.1000.
Regarding the existing development, it can be noted that the upward movement from the level of 1.0775 has already gained more than 200 points, and this is approximately 54% of the downward cycle on 03/30/20/06/04. This means it cannot be said that we are in correction relative to the previous move since the current movement already has significant scales. It turns out that we are in a local trend, but relative to February 2020, the picture looks very different. When you open the daily chart, you will see a number of inertial movements, where each successive round has a compression relative to the previous one.
Inertia:
1) 02.20.20 - 09.03.20
2) 03/10/20 - 03/20/20
3) 03/23/20 - 03/27/20
4) 03/30/20 - 04/06/20
5) 04/07/20 - 04/14/20
If we take into account the inertia indices from 2 to 5, then we will see the very regularity in the form of compression. Based on the available data, it is possible to develop a theory where each subsequent move will have approximately 50-60% of the working out of the previous one and, as a result, the amplitude will be compressed. With the overestimation of successive oscillations, compression can occur and exit from the pattern in the form of a new round of impetuous impulse.
If the theory is correct, then the existing round of inertia [04/07/20 - 04/14/20] should be won back by at least 50%.
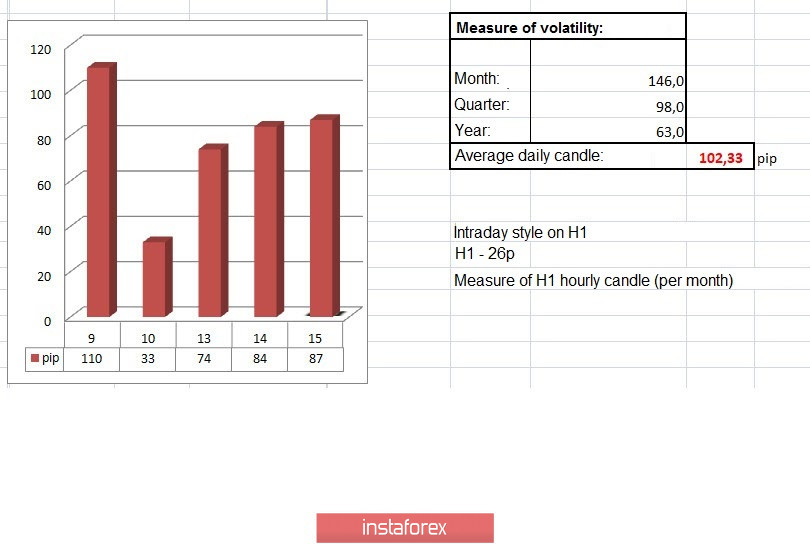
In terms of volatility, we continue to record a characteristic slowdown, not only in daily terms but also in the average daily calculation. This phenomenon is completely normal, especially with such a protracted acceleration as we had.
Details of volatility: Monday - 155 points; Tuesday - 183 points; Wednesday - 115 points; Thursday - 278 points; Friday - 166 points; Monday - 151 points; Tuesday - 234 points; Wednesday - 243 points; Thursday - 326 points; Friday - 194 points; Monday - 191 points; Tuesday - 160 points; Wednesday - 133 points; Thursday - 188 points; Friday - 194 points; Monday - 134 points; Tuesday - 127 points; Wednesday - 136 points; Thursday - 147 points; Friday - 91 points; Monday - 67 points; Tuesday - 142 points; Wednesday - 72 points; Thursday - 110 points; Friday - 33 points; Monday - 74 points; Tuesday - 84 points. The average daily indicator, relative to the dynamics of volatility, is 102 points [see the table of volatility at the end of the article].
As discussed in a previous review, traders considered local long positions in the event of a breakdown of Monday's maximum of 1.0967.
The news background of the past day did not have a stream of statistical data, and market participants worked on an external background, including data on new cases of infection with the COVID-19 virus.
In terms of information flow, panic reoccurred amid growing virus infection in the United States, where at first Donald Trump firmly announced an improvement in the situation and restoration of production facilities in late April, but then it is not yet clear when it will all be done. Let me remind you that France has already extended restrictive measures in the country to counter the coronavirus for another four weeks, until May 11, while Britain is already one step ahead of this decision. If the situation in the United States worsens or persists, quarantine measures could theoretically also be extended.
Today, rumors about a possible extension of the transitional period for Brexit traveled so fast amongst the speculators of the pound sterling and the euro.
In terms of the economic calendar, we had inflation data in a number of European countries for this day. As expected, there was a decrease of 0.1% in Italy coming from a previous 0.3%, Spain, on the other hand, had it worse with a decrease of 0.00% from 0.7%, while in France the slowdown was slightly less than the forecast, from 1.4% to 0.7.
Naturally, inflation data did not play into the hands of the euro.
In the afternoon we expect macroeconomic data for the United States, where they reported a significant decline in retail sales from 4.3% in February to 2.0% in March. This factor may exert local pressure on the greenback.
Further development
Analyzing the current trading chart, we see a rapid downward movement from the area of the psychological level of 1.1000, where the quotes almost managed to reach the Monday low of 1.0893. In fact, a distinct speculative gulf is visible against the background of statistical data, as well as the external background. In terms of the above theory, a new measure can still lead the quotes to the area of the middle of the local trend of 1.0850. At the same time, against the background of local overselling, coupled with Monday's low, as well as statistics from the United States, a temporary rebound may occur.
Parsing the time segment every minute, we see that the downward spiral appeared as early as 02:00 UTC and lasted until 11:00 UTC, the time at the trading terminal.
It can be assumed that we are expected to have a temporary chatter within 1.0890 / 1.0925, where work can be built on two strategies at once. So, the first tactic comes from oversold and statistical data for the USA, where in case of consolidation higher than 1.0935, we will expect a local move in the direction of 1.0950-1.1000. The second strategy proceeds from the above theory, and in this case, the quotes must consolidate lower than 1.0890, with the prospect of a move to 1.0850.
Based on the above information, we derive trading recommendations:
-You can consider purchase positions higher than 1.0935, with the prospect of a move to 1.0950-1.1000.
- You can consider selling positions lower than 1.0890, with the prospect of a move to 1.0850.
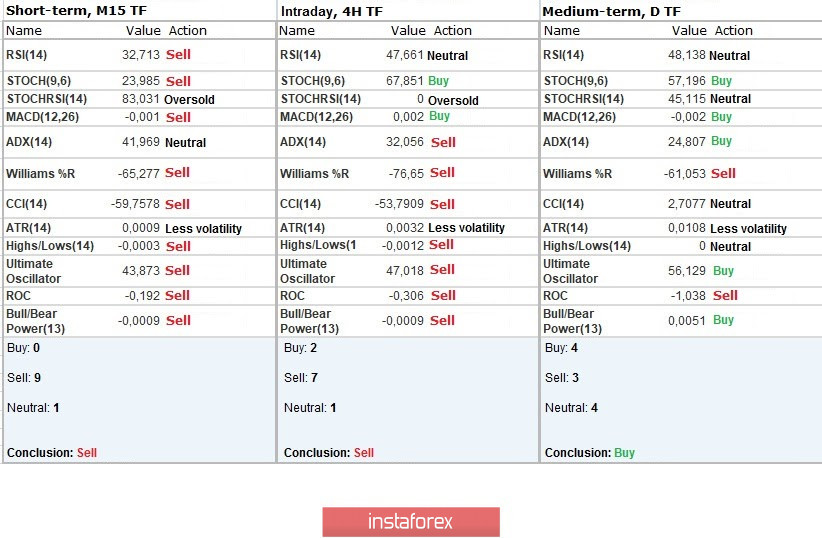
Indicator analysis
Analyzing a different sector of timeframes (TF), we see that the indicators of technical tools regarding hour and minute intervals signal a sale. At the same time, daytime areas still reflect an earlier upward trend.
Volatility per week / Measurement of volatility: Month; Quarter; Year
Volatility measurement reflects the average daily fluctuation calculated for the Month / Quarter / Year.
(April 15 was built taking into account the time of publication of the article)
The volatility of the current time is 87 points, which is only 14% lower than the daily average. It can be assumed that the activity already has impressive dimensions, where the subsequent fluctuation is maximum, which may expand the scope to an average.
Key levels
Resistance zones: 1,1000 ***; 1.1080 **; 1,1180; 1.1300; 1.1440; 1.1550; 1.1650 *; 1.1720 **; 1.1850 **; 1,2100
Support areas: 1.0850 **; 1.0775 *; 1.0650 (1.0636); 1,0500 ***; 1.0350 **; 1,0000 ***.
* Periodic level
** Range Level
*** Psychological level