EUR/USD 24-hour TF analysis.
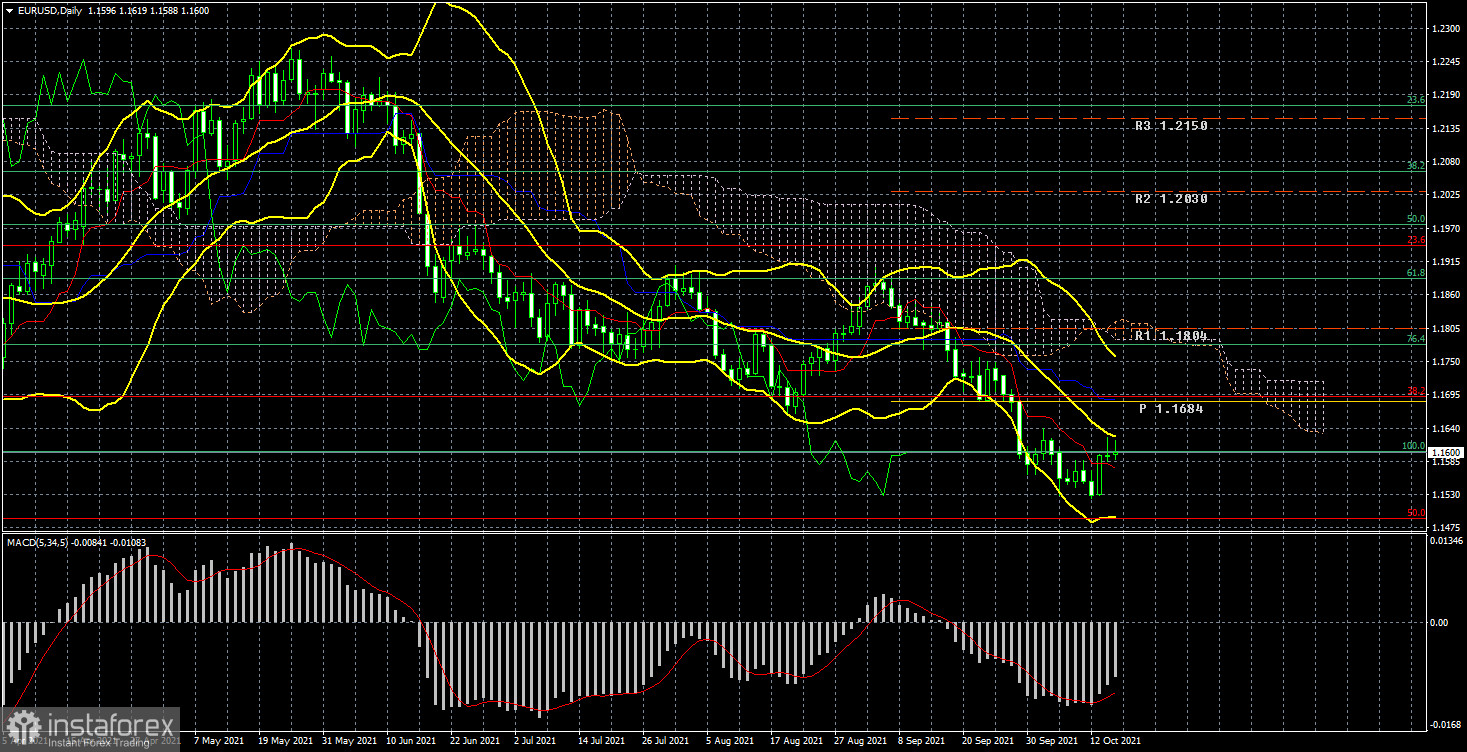
The EUR/USD currency pair tried to start a new round of correction against the current downward trend during the current week. Recall that the last round of the pair's fall from the level of 1.2260 to the current 1.1600 is still interpreted as a correction against the global upward trend. The illustration above clearly shows that the pair has almost worked out the Fibonacci level of 50.0% (1.1490). At the moment, in 9 months of correction, the price was able to roll back from its 3-year highs by slightly less than 50%. It is quite enough to correct, but at this time, the prospects for the growth of the euro or the dollar cause the same amount of doubt. Recall that a month ago, we expected the formation of a new upward trend and the departure of the pair above the current 3-year high of 1.2260. Our forecast was based on the fact that the American economy continues to pump trillions of dollars from the Fed, which provokes strong inflation and increases the supply of the dollar in the foreign exchange market. However, the markets decided otherwise. For more than a month, the almost recoilless strengthening of the US currency has been going on, the reasons and explanations for which are very difficult to find now. We assumed that such a movement of the pair was caused by the markets' expectations regarding the curtailment of the Fed's QE program. However, it is possible to wait in this mode for a very long time since there are no guarantees that the Fed will announce the beginning of the withdrawal of incentives in November. Especially after the relatively weak Nonfarm reports over the past two months.
Nevertheless, the US dollar continues to grow paired with the euro. Because paired with the pound, it has been declining for two weeks. And this uncorrelation also makes you wonder what is going on in the foreign exchange market right now? If the euro were falling out of the situation in the European Union, then everything would be logical. However, nothing interesting is happening in the EU right now. In such an incomprehensible situation, we recommend paying closer attention to the technical picture.
Analysis of the COT report.
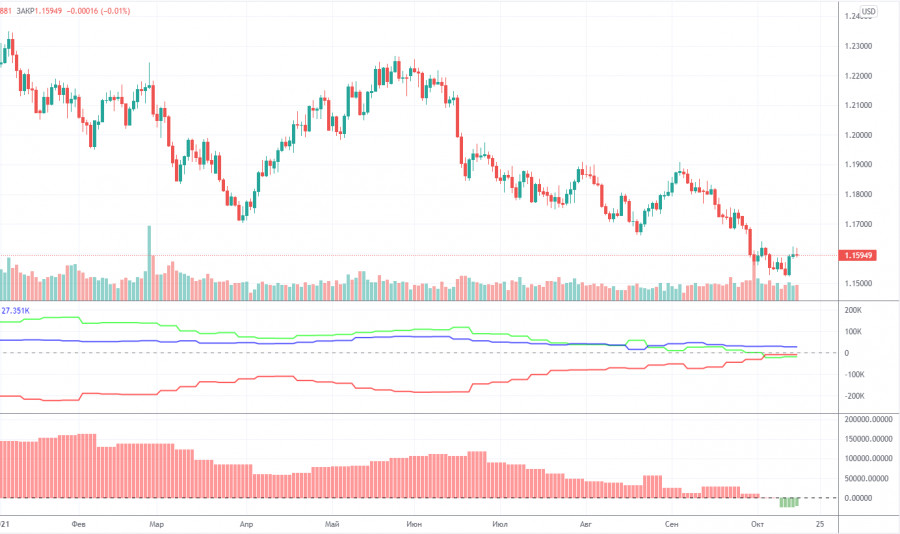
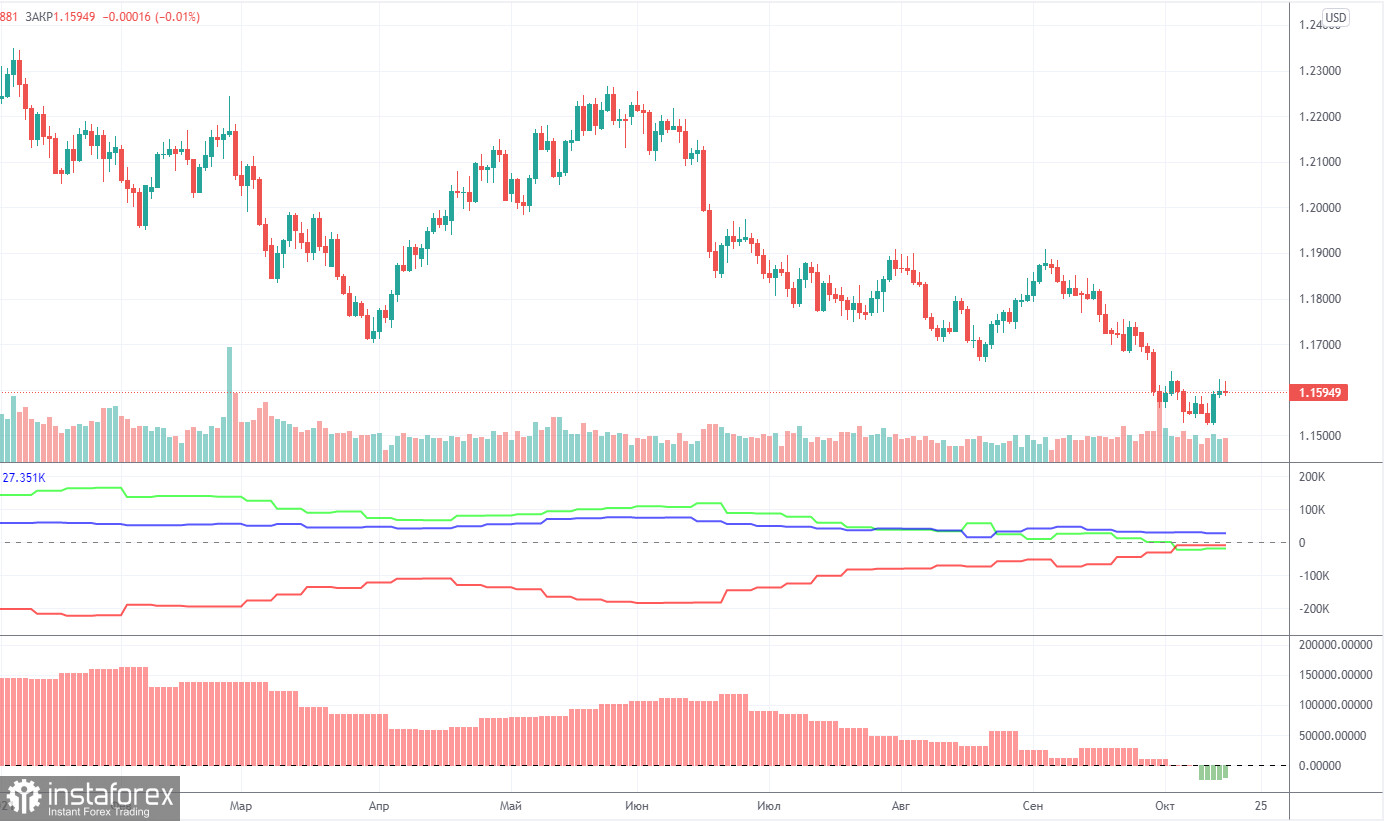
During the last reporting week (October 5-11), the mood of non-commercial traders has not changed much. It even became a little less "bearish." But still, it is already "bearish" since, for the first time in a long time, the total number of open sell orders from the "Non-commercial" group exceeds the total number of open purchase contracts (222 thousand versus 203 thousand). During the reporting week, professional traders opened 5.7 thousand buy contracts and 2.4 thousand sell contracts. Thus, the net position increased by 3.3 thousand contracts. However, such a change is considered scanty for the overall picture of things. We pay attention to another fact. At the beginning of this year, the net position of major players exceeded 150 thousand, and since then, the European currency has fallen in price by only 6 cents. The net position has lost about 170 thousand contracts. We believe that the European currency has fallen too little in price, given the changes in contract data from professional players. We also draw attention to the fact that the European currency is falling very weakly as we have calculated more than once, by about 15 points per day. However, the volatility remains very weak. It is the weak volatility that makes us doubt everything that is happening with the pair now. The US dollar still does not look like a currency that can show a strong trend in the near future.
Nevertheless, it continues to grow for more than a month. As a result, COT reports now show a very likely continuation of the fall of the euro currency. But we also recommend correlating these findings with the current technical picture.
Analysis of fundamental events.
There were few macroeconomic and fundamental events this week. By and large, all the most interesting things happened on Wednesday, when the inflation report for September was published in the States, as well as the minutes from the last Fed meeting. On this day, the US dollar fell by 65 points, which has not happened to it since August 13. It turned out that American inflation did not continue to decline but, on the contrary, began to accelerate again. And although earlier, any increase in inflation provoked a rise in the dollar, this time it was different. Even more important (albeit very indirect) was the Fed protocol, according to the publication. The markets could understand only one thing: there is no consensus on the timing of the curtailment of the QE program at the Fed. Some of the monetary committee members approve of November, and some are in favor of December. Some believe that we need to wait even longer. There is also no general opinion on the issue of the volume of QE reduction. Thus, the Fed's protocol did not give any certainty to the markets, which is why the dollar could fall.
Trading plan for the week of October 18 - 22:
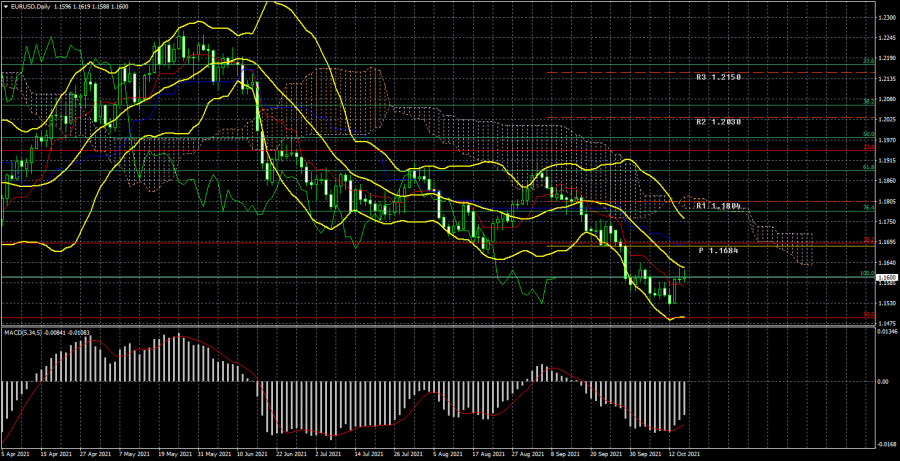
1) On the 24-hour timeframe, the upward trend has not changed since the bulls failed to develop success and overcome the level of 1.1885. At the moment, the pair continues its downward movement and has overcome the important levels of 1.1700 and 1.1600. Thus, the fall may resume next week with a target of 1.1490. This level is a 50% correction from the entire upward trend. The Ichimoku and Bollinger Bands indicators also indicate a downward movement, so we advise you to continue considering sales since there are no signals to buy now.
2) As for purchases of the euro/dollar pair, they should be considered no earlier than fixing the price above the critical line in the current conditions. There are few prerequisites for a new upward trend to begin in the near future now.
Explanations to the illustrations:
Price levels of support and resistance (resistance /support), Fibonacci levels - target levels when opening purchases or sales. Take Profit levels can be placed near them.
Ichimoku indicators(standard settings), Bollinger Bands(standard settings), MACD(5, 34, 5).
Indicator 1 on the COT charts - the net position size of each category of traders.
Indicator 2 on the COT charts - the net position size for the "Non-commercial" group.