EUR/USD 5M
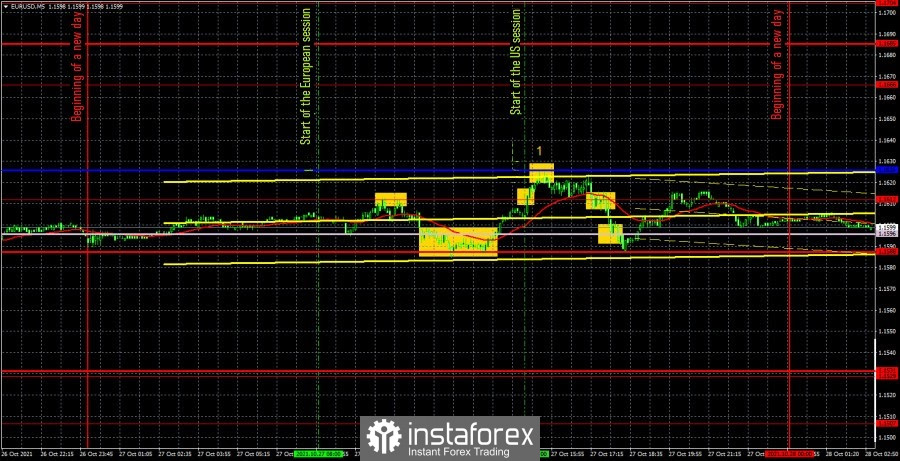
The EUR/USD pair continued to move exclusively in a horizontal channel during the third trading day of the week. The night flat should not surprise at all, since the pair traded practically without moving every day during the Asian trading session. However, a flat was also observed during the European and US sessions. The pair spent the whole day between the Kijun-sen line (1.1626) and the 1.1588 support level, that is, in a 38-point horizontal channel. It is noteworthy that the Senkou Span B line and the extremum level of 1.1612 are also located between these two lines. Thus, the distance between all levels was no more than 10-15 points. And this, in turn, forced us to consider all these levels not separately, but as areas of support or resistance. However, the problem is that there were four of them and the price was only between them. Therefore, by and large, all trading signals of the day should be ignored, since the distance between the targets was too small, and a rebound could follow from each individual level or line. We also remind you that the lines of the Ichimoku indicator are weak in the flat. A rather strong sell signal was formed near the Kijun-sen line yesterday, but this could have been a common coincidence. The risks were higher. Macroeconomic reports finally came out on Wednesday. The United States has published a single report on durable goods orders for September. This indicator decreased by 0.4% m/m against the forecast of -1.1% m/m. Thus, on the one hand, the actual value was better than the predicted value, and on the other hand, it still indicates a decrease. And in any case, immediately after this release, the markets did not show any reaction. The euro began to fall later.
EUR/USD 1H
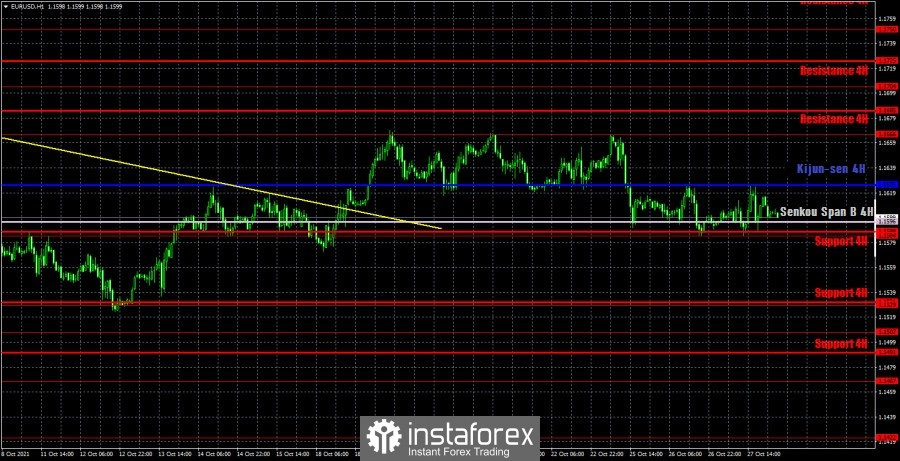
It is even better seen that the pair continues to move mainly sideways on the hourly timeframe. Thus, the trend movement is now absent with all the ensuing consequences. Trading in flat conditions is not the most pleasant experience. Moreover, now there is not even a pronounced lateral channel with clear boundaries. In general, the technical picture is as unattractive as possible. We highlight the following levels for trading on Thursday - 1.1529, 1.1584, 1.1666, as well as the Senkou Span B (1.1596) and Kijun-sen (1.1625) lines. The Ichimoku indicator lines can change their position during the day, which should be taken into account when looking for trading signals. Signals can be rebounds or breakthroughs of these levels and lines. Do not forget about placing a Stop Loss order at breakeven if the price moves 15 points in the right direction. This will protect you against possible losses if the signal turns out to be false. Also, do not forget that the lines of the Ichimoku indicator lose their strength in a flat, so they can even be ignored, especially the Kijun-sen line. Or work out only when there are really strong signals. There will be a lot of really important events and reports in the United States and the European Union on October 28. Thursday is the most important day of the week. The European Union will sum up the results of the European Central Bank meeting. And although the markets are not expecting any major changes in monetary policy, nevertheless, the monetary policy report and ECB President Christine Lagarde's speech may provide new information to which a reaction may follow. Also, the US will publish a report on GDP for the third quarter. According to forecasts, this figure may slow down to 2.6% qoq, which is unlikely to please the bears. Nevertheless, everything will depend on how much the actual value will differ from the forecast and in which direction.
We recommend you to familiarize yourself:
Forecast and trading signals for GBP/USD for October 28. Detailed analysis of the movement of the pair and trade deals.
Analysis of the COT report

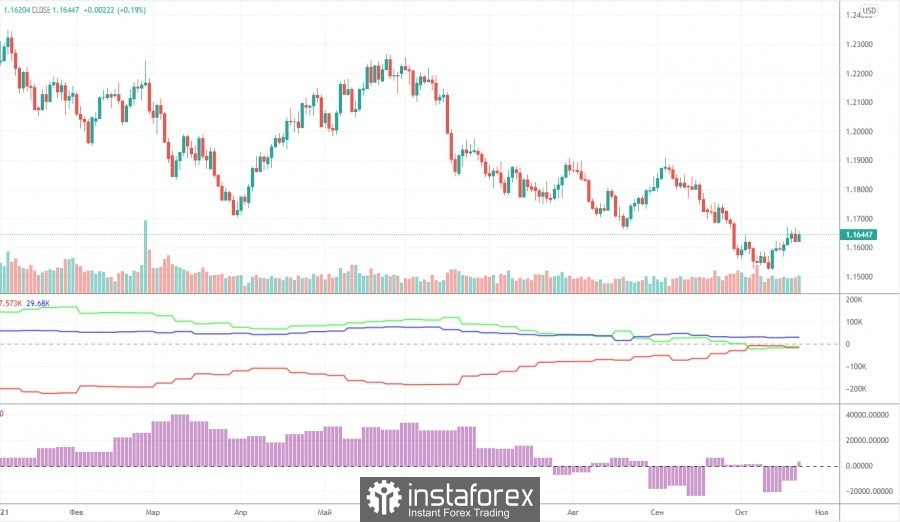
The mood of non-commercial traders changed into a bullish direction during the last reporting week (October 12-18). During the reporting week, 8,500 buy contracts (longs) and 16,000 sales contracts (shorts) were closed. Thus, the net position of the "non-commercial traders" group, which is the most important group, increased by 7.5 thousand. And here it is just right to talk about the "disease of the British pound." Let us remind you that the net position of professional pound players has been jumping up and down over the past few months. And this, in turn, indicates that there is no single mood and clear trend. We are seeing the same thing now in the euro currency. This is eloquently signaled by the second indicator, which shows either an increase in the net position or a decrease. Consequently, at this time, major players do not understand what to do next with the euro currency. Also, in the chart above, you can see that the pair rate went only 100 points below the previous local low. Therefore, at this time, the entire technical picture of the long-term plan still looks like a standard three-wave correction. Therefore, from our point of view, the formation of a new upward trend in the near future is still very likely, given the attempts with which the European currency has been falling over the past 8-9 months. But at the same time, we remind you that while there are no buy signals, you should not rush to the market with long positions. Any fundamental hypothesis requires specific technical confirmation. If they are not there, then you should not make the appropriate trading decisions.
Explanations for the chart:
Support and Resistance Levels are the levels that serve as targets when buying or selling the pair. You can place Take Profit near these levels.
Kijun-sen and Senkou Span B lines are lines of the Ichimoku indicator transferred to the hourly timeframe from the 4-hour one.
Support and resistance areas are areas from which the price has repeatedly rebounded off.
Yellow lines are trend lines, trend channels and any other technical patterns.
Indicator 1 on the COT charts is the size of the net position of each category of traders.
Indicator 2 on the COT charts is the size of the net position for the non-commercial group.