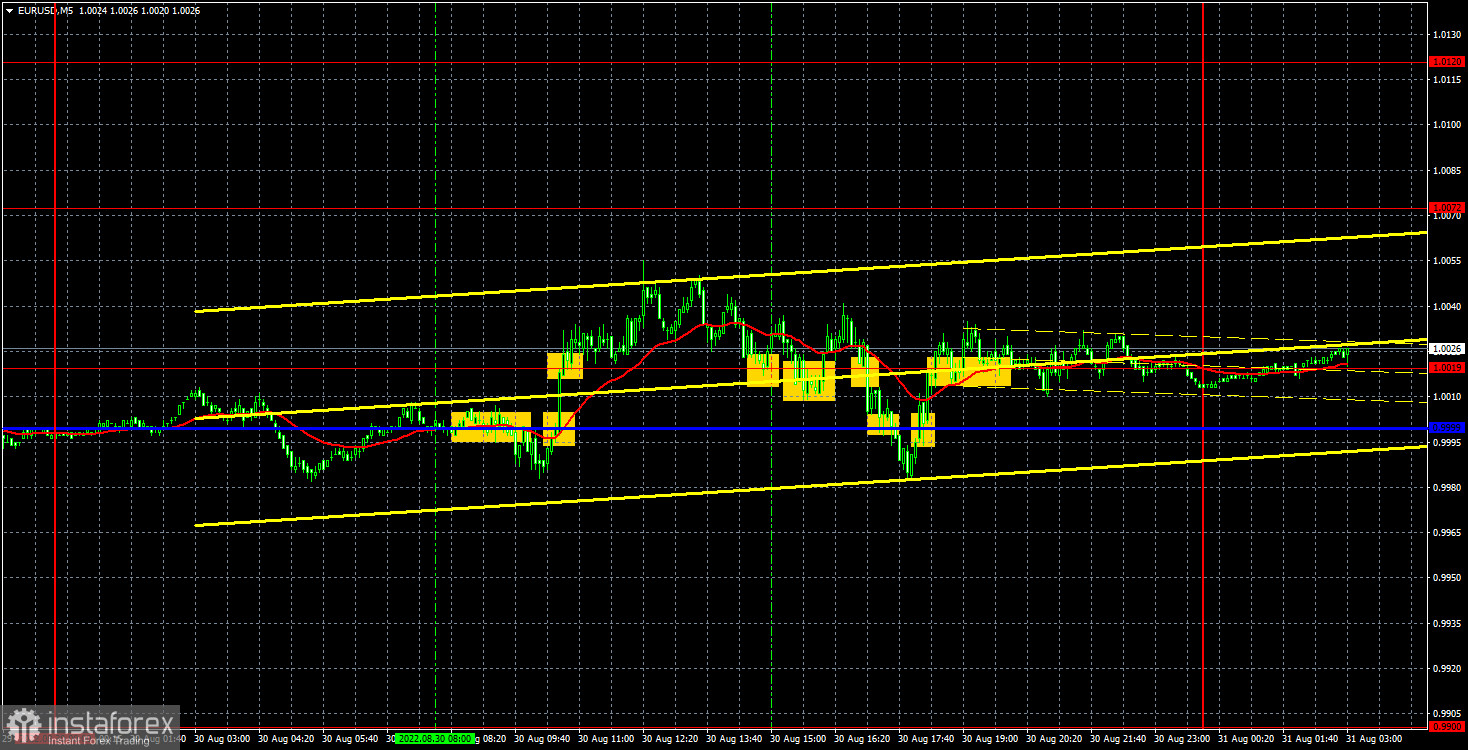
EUR/USD 5M
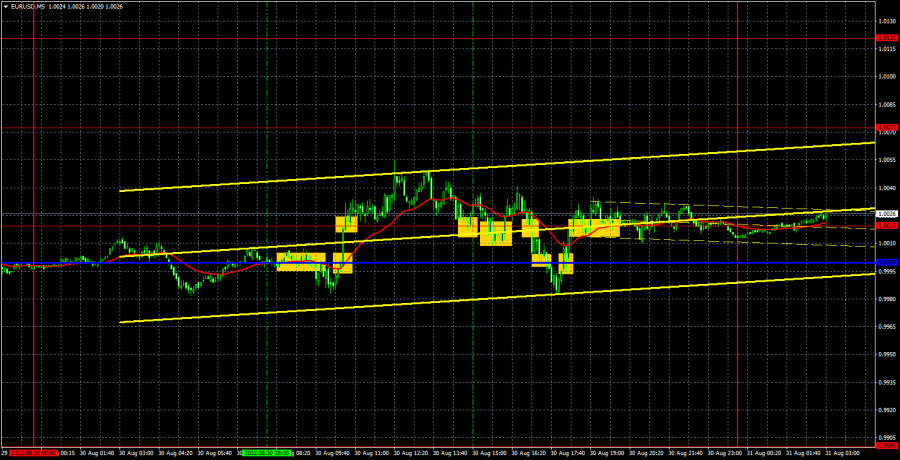
The EUR/USD pair traded very poorly on Tuesday. The movement is not too similar to a flat on the hourly timeframe, but at the same time it proceeds in a very limited range. It can also be interpreted as "swing". We would say that we are now seeing something in between these two types of movement. And if separately flat and "swing" are very dangerous for traders, then the symbiosis of these two modes is even worse. Recall that in a flat, the lines of the Ichimoku indicator are weak and false signals are often formed near them. Or the price simply ignores them. Levels are also often not worked out properly, and it is almost impossible to predict where the pair will go in the next hour, even if there is a fundamental or macroeconomic background. But there was no background on Tuesday. Formally, the downward trend remains, but at the same time, the price overcame the downward trend line a few days ago. Then, it turns out, there is now an upward trend? But after all, the euro practically does not grow! In general, a very complex and confusing situation.
In regards to trading signals, the picture was no better yesterday. Almost all signals near the critical line were false, which is not surprising. The signals around the 1.0019 level were also false. The volatility of the day was about 70 points, which is not much, but not enough for the euro. The movement was jerky. In general, the most unattractive conditions for trading. We assume that traders could open several trades on false signals. At best, they managed to close them at breakeven by Stop Loss, since the price from time to time went in one direction at least 30-40 points.
COT report:
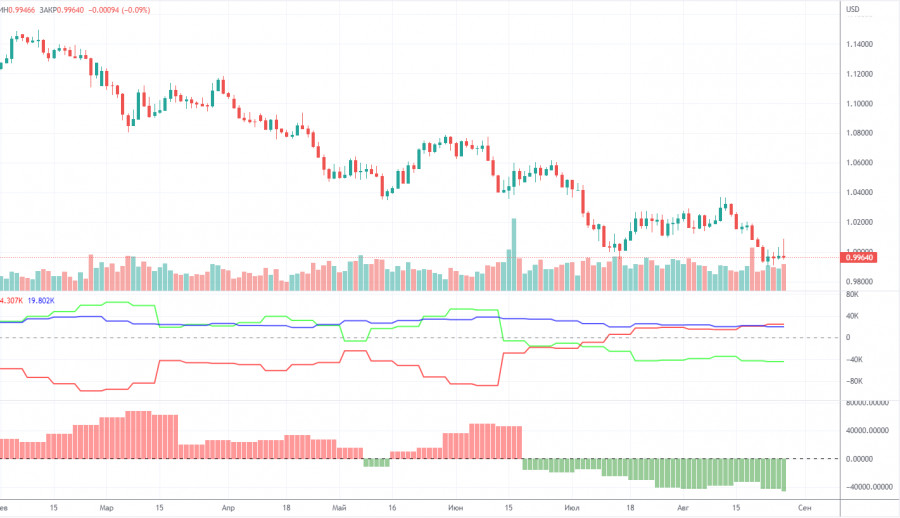
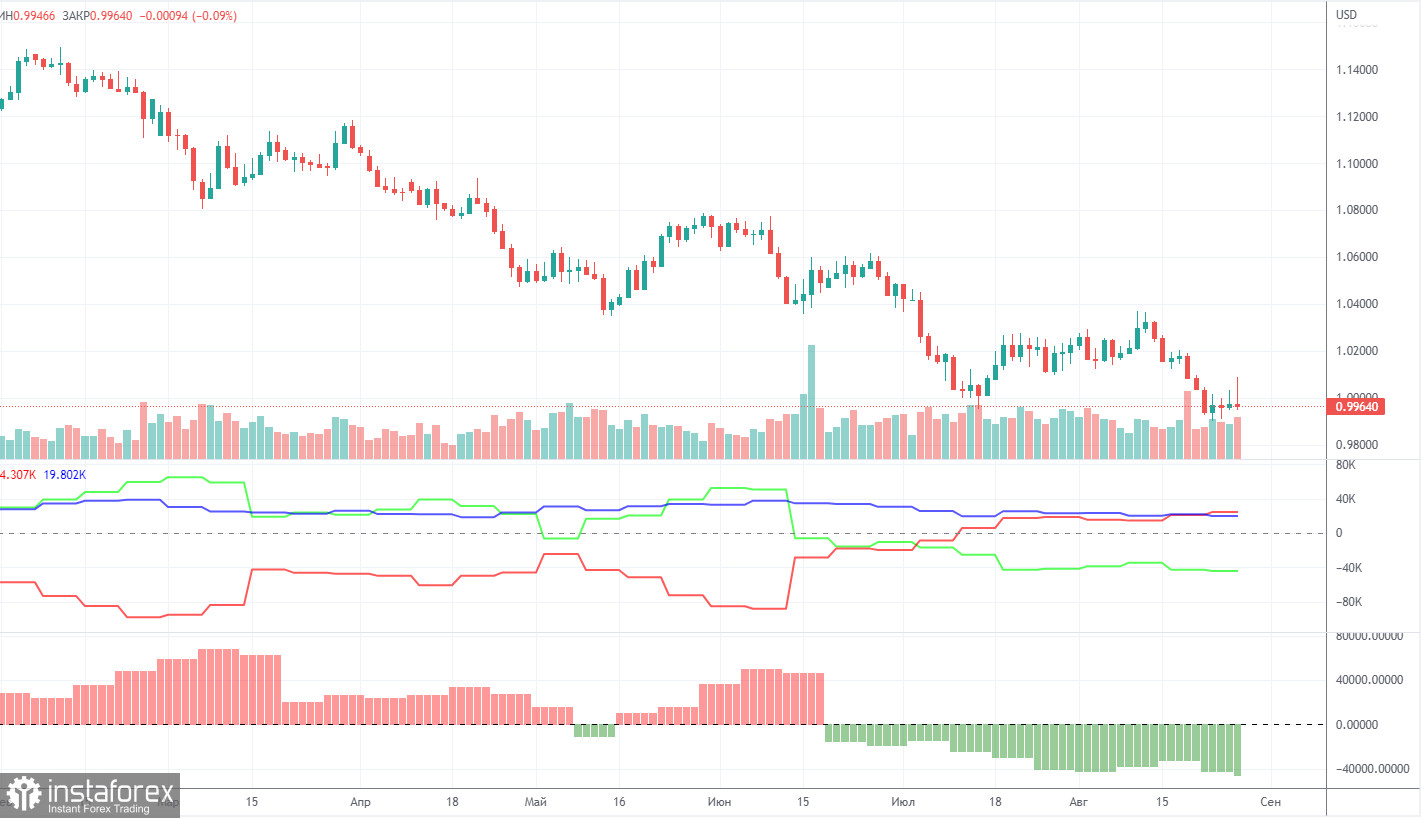
The Commitment of Traders (COT) reports on the euro in the last few months clearly reflect what is happening in the euro/dollar pair. For most of 2022, they showed an openly bullish mood of commercial players, but at the same time, the euro fell steadily at the same time. At this time, the situation is different, but it is NOT in favor of the euro. If earlier the mood was bullish, and the euro was falling, now the mood is bearish and... the euro is also falling. Therefore, for the time being, we do not see any grounds for the euro's growth, because the vast majority of factors remain against it. The number of long positions for the non-commercial group increased by 11,600, and the number of shorts increased by 12,900 during the reporting week. Accordingly, the net position increased by about 1,300 contracts. After several weeks of weak growth, the decline in this indicator resumed, and the mood of major players remains bearish. From our point of view, this fact very eloquently indicates that at this time even commercial traders still do not believe in the euro. The number of longs is lower than the number of shorts for non-commercial traders by 44,000. Therefore, we can state that not only does the demand for the US dollar remain high, but that the demand for the euro is also quite low. The fact that major players are in no hurry to buy the euro may lead to a new, even greater fall. Over the past six months or a year, the euro has not been able to show even a tangible correction, not to mention something more.
We recommend to familiarize yourself with:
Overview of the EUR/USD pair. August 31. The ECB has woken up and is uncovering its weapon against inflation.
Overview of the GBP/USD pair. August 31. Britain needs investment and tax cuts.
Forecast and trading signals for GBP/USD on August 31. Detailed analysis of the movement of the pair and trading transactions.
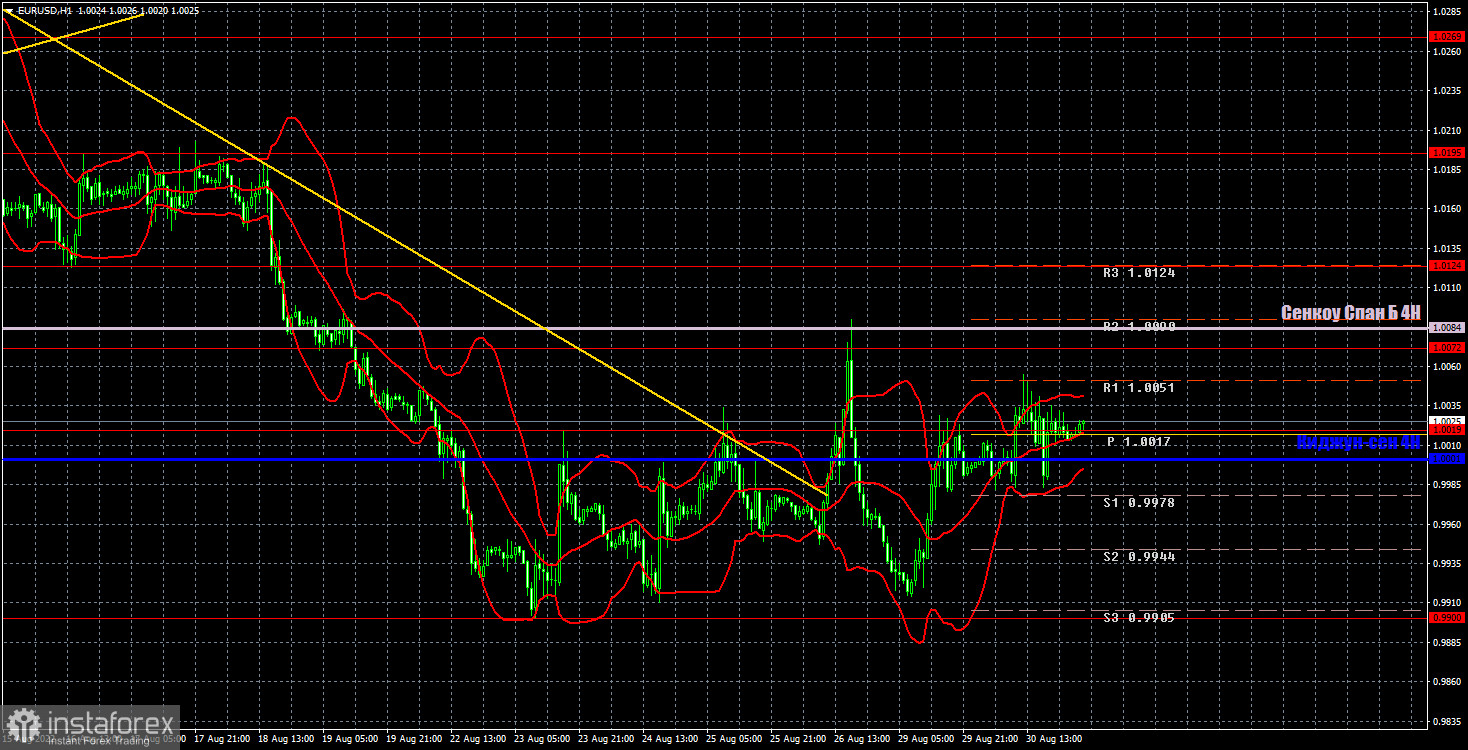
EUR/USD 1H
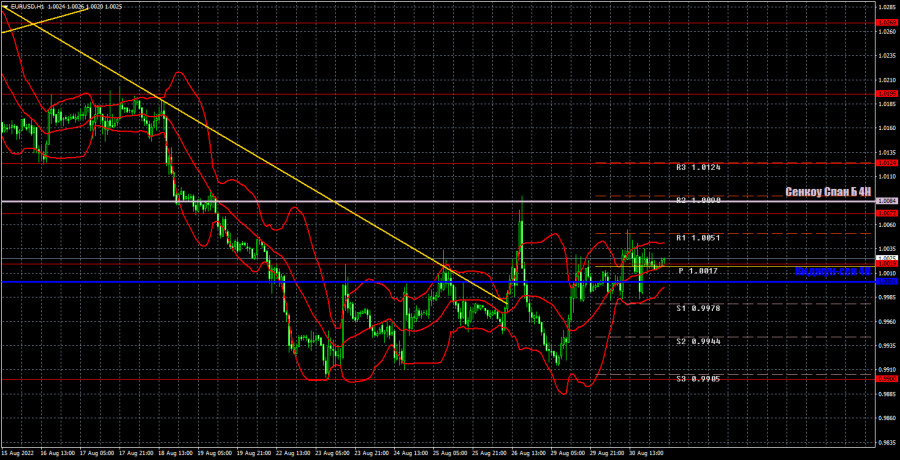
The pair has consolidated above the trend line on the hourly timeframe, but still does not leave the feeling that the downward trend continues. At the moment, the pair is generally trading inside the horizontal channel, but this channel has already expanded to 0.9900-1.0072. In addition, the movement is similar to both a flat and a "swing", so in any case, you need to trade as carefully as possible. We highlight the following levels for trading on Wednesday - 0.9900, 1.0019, 1.0072, 1.0124, 1.0195, 1.0269, as well as Senkou Span B (1.0084) and Kijun-sen (1.0001). There is not a single level below the level of 0.9900, so there is simply nothing to trade there. Ichimoku indicator lines can move during the day, which should be taken into account when determining trading signals. There are also secondary support and resistance levels, but no signals are formed near them. Signals can be "rebounds" and "breakthrough" extreme levels and lines. Do not forget about placing a Stop Loss order at breakeven if the price has gone in the right direction for 15 points. This will protect you against possible losses if the signal turns out to be false. The European Union will publish a report on inflation for August, and this may be interesting. However, this report does not guarantee that the "swing" will end. On the contrary, it can support them. Meanwhile, we have the ADP report in the United States, which is unlikely to be of interest to the market.
Explanations for the chart:
Support and Resistance Levels are the levels that serve as targets when buying or selling the pair. You can place Take Profit near these levels.
Kijun-sen and Senkou Span B lines are lines of the Ichimoku indicator transferred to the hourly timeframe from the 4-hour one.
Support and resistance areas are areas from which the price has repeatedly rebounded off.
Yellow lines are trend lines, trend channels and any other technical patterns.
Indicator 1 on the COT charts is the size of the net position of each category of traders.
Indicator 2 on the COT charts is the size of the net position for the non-commercial group.