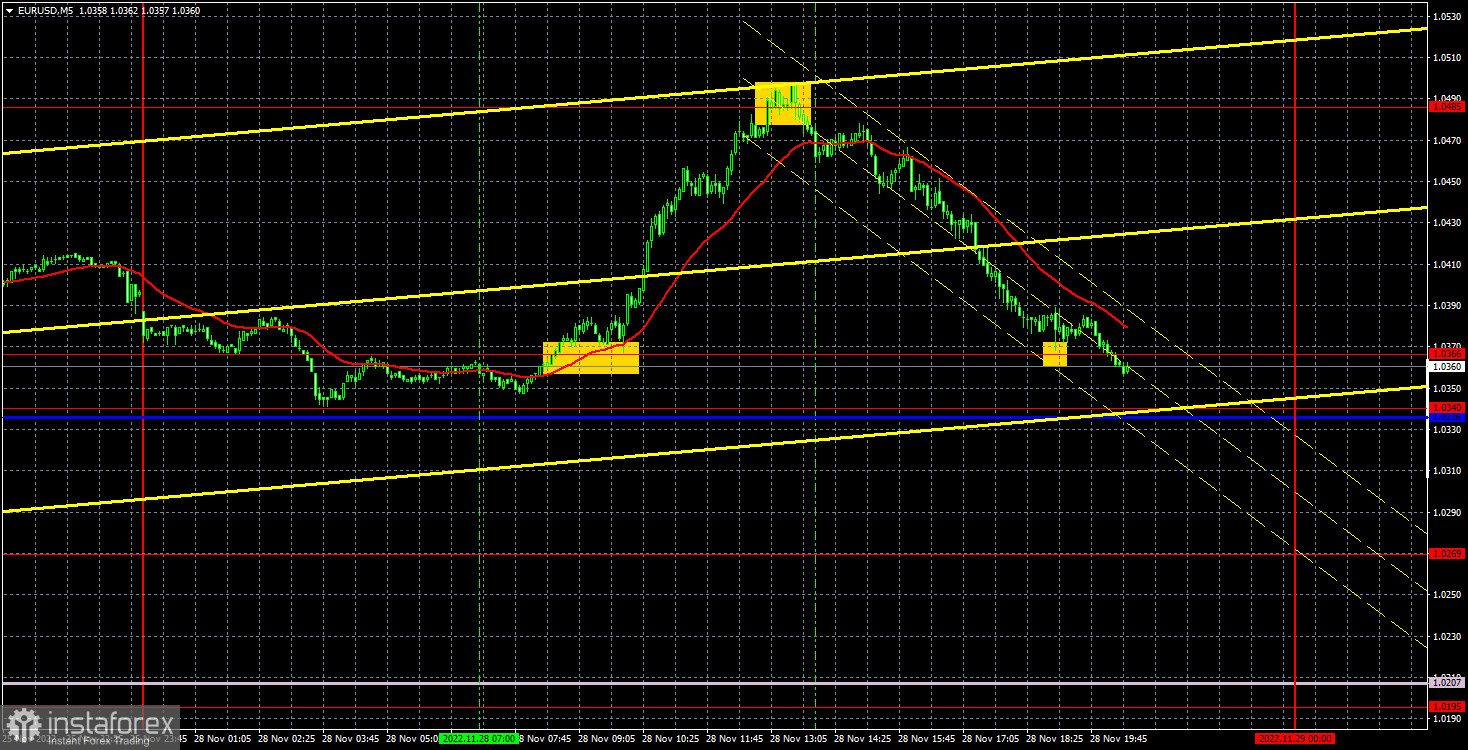
empty
 
 
29.11.2022 07:05 AM
Outlook and trading signals for EUR/USD on November 29. COT report. Analysis of market situation. Euro and the rollercoaster

M5 chart of EUR/USD

This image is no longer relevant

On Monday, the euro/dollar pair showed certain movements that are quite difficult to explain. It started to sharply rise early in the morning and crossed a distance of 150 pips. Then it began to fall by the same amount in the afternoon. The only fundamental background was European Central Bank President Christine Lagarde's speech, which took place in the evening, so it could not have provoked such movements. Therefore, the pair has reached 1.0485, near which the previous local high was formed, and sharply fell. I believe that this pullback could be the start of the long-awaited bearish correction, which I already mentioned last week. The price may cross the critical line in the near future, which will be another technical factor for the fall. I expect the Senkou Span B line to be the first target, but the correction might be much stronger, since the euro's growth for the past few weeks was not quite logical and reasonable.

As for trading signals, yesterday's situation was almost perfect. At the beginning of the European trading session, the price broke through the level of 1.0366, after which it rose to the nearest target level of 1.0485 and rebounded from it. Therefore, traders had to open a long position first, and then - a short position. They managed to earn about 90 pips on the first position, and also the same amount on the second one since the price went back to the level of 1.0366. As a result, two deals, good profit.
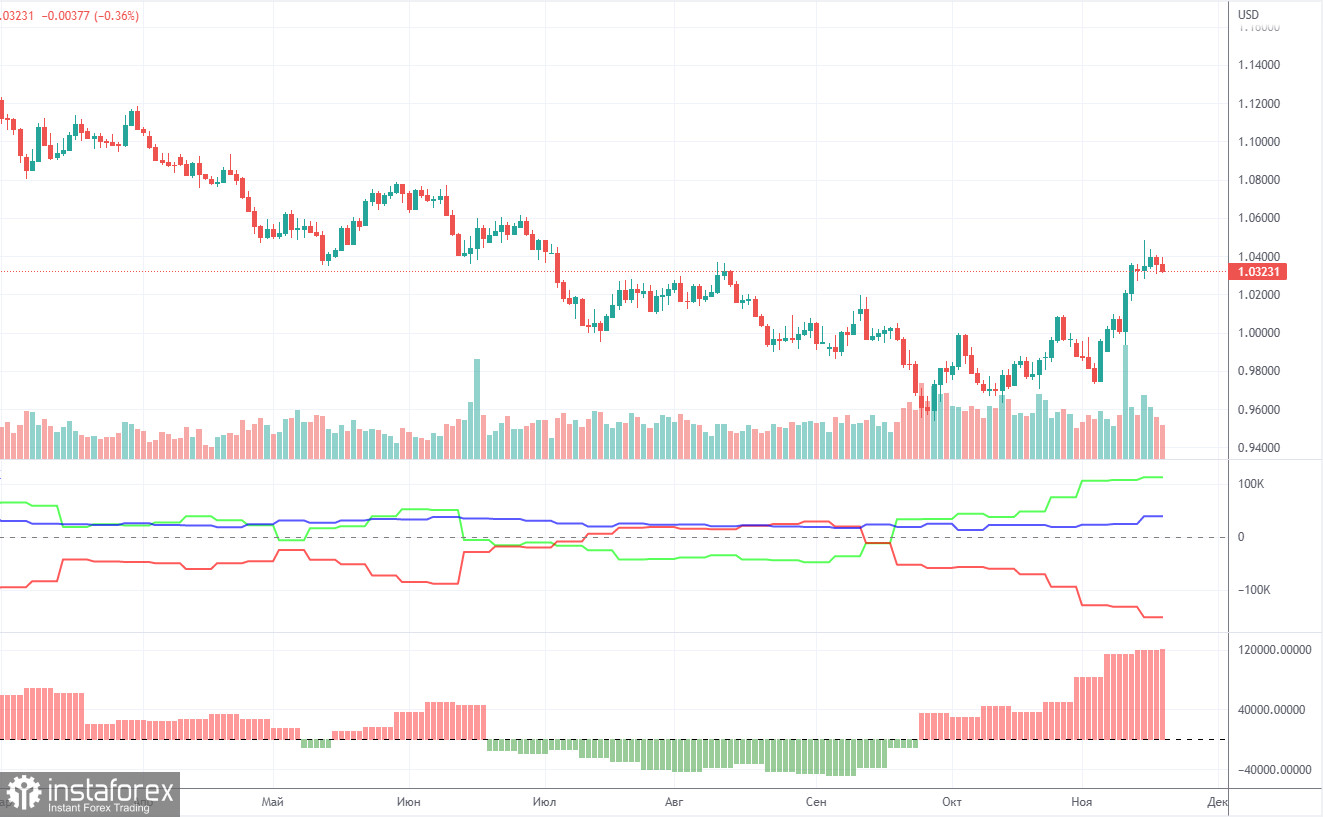
COT report

This image is no longer relevant

As for Commitment of Traders (COT) reports in 2022, they reflected bullish sentiment in the first six months of the year although the euro was bearish. Then, they illustrated bearish sentiment for several months with the euro being also bearish. Currently, the net position of non-commercial traders is again bullish and increasing. Meanwhile, the euro has hardly retreated from its 20-year lows. This is due to the fact that demand for the greenback is high amid a difficult geopolitical situation in the world. Therefore, despite a rise in demand for the euro, buoyant demand for the dollar does not allow the euro to strengthen. During the reporting week, the number of long positions held by non-commercial traders rose by 7,000 and that of short positions increased by 2,000. Consequently, the net position advanced by 5,000. The euro's recent growth is gradually coming in line with the figures illustrated in the COT report. Still, the greenback may resume growth under the influence of geopolitical factors or the lack of factors for further strengthening in the euro. The green and red lines of the first indicator moved far away from each other, which may indicate the end of the uptrend. The number of long positions exceeds that of short positions by 113,000. Therefore, the net position of non-commercial traders may continue to rise further, but without triggering a similar rise in the euro. When it comes to the total number of longs and shorts across all categories of traders, there are now 39,000 more short positions (635,000 vs 596,000).
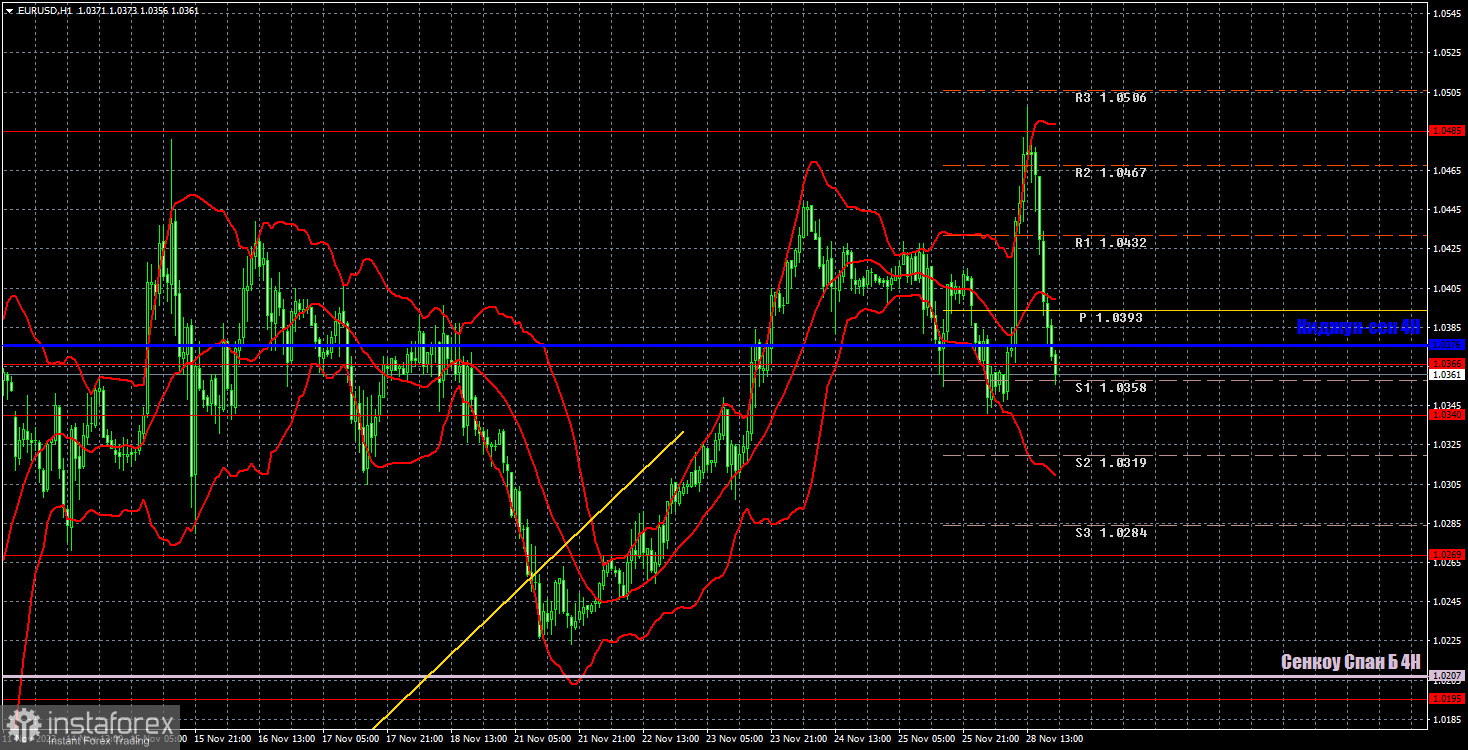
H1 chart of EUR/USD

This image is no longer relevant

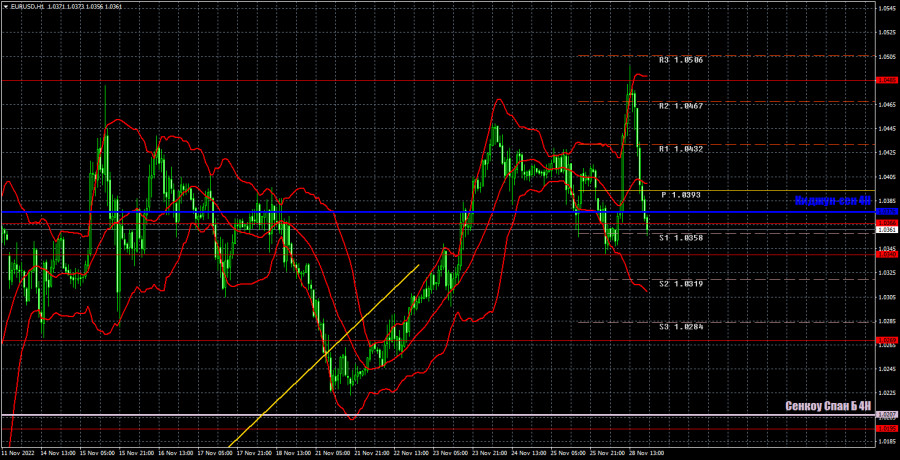
Lately, EUR/USD has shown absolutely inadequate movements on the one-hour chart. It still hasn't started a downward movement even after it crossed the ascending trend line. Yesterday, the pair updated its last local high, but failed to break through the important level of 1.0485. And now it may start a strong bearish correction, which we already expected a week ago. On Tuesday, the pair may trade at the following levels: 1.0124, 1.0195, 1.0269, 1.0340-1.0366, 1.0485, 1.0579, 1.0637, as well as Senkou Span B lines (1.0207) and Kijun Sen (1.0376). Lines of the Ichimoku indicator may move during the day, which should be taken into account when determining trading signals. There are also support and resistance levels, but signals are not formed near these levels. Bounces and breakouts of the extreme levels and lines could act as signals. Don't forget about stop-loss orders, if the price covers 15 pips in the right direction. This will prevent you from losses in case of a false signal. On November 29, there are no important events planned in the EU and the U.S., but Monday showed us that the pair is ready to move in a volatile manner even without them.

What we see on the trading charts:

Price levels of support and resistance are thick red lines, near which the movement may end. They do not provide trading signals.

The Kijun-sen and Senkou Span B lines are the lines of the Ichimoku indicator, moved to the one-hour chart from the 4-hour one. They are strong lines.

Extreme levels are thin red lines from which the price bounced earlier. They provide trading signals.

Yellow lines are trend lines, trend channels, and any other technical patterns.

Indicator 1 on the COT charts reflects the net position size of each category of traders.

Indicator 2 on the COT charts reflects the net position size for the non-commercial group.

EURUSD
Euro vs US Dollar
Select timeframe
5
min
15
min
30
min
1
hour
4
hours
1
day
1
week
Start trade
Start trade
  • Grand Choice
    Contest by
    InstaForex
    InstaForex always strives to help you
    fulfill your biggest dreams.
    UNIRSE AL CONCURSO
  • Depósito al azar
    ¡Haga un depósito en su cuenta de $3,000 y obtenga $8000 más!
    ¡En Marzo, sorteamos $8000 dentro de la campaña Depósito afortunado!
    Obtenga la oportunidad de ganar depositando $3,000 en una cuenta de operaciones. Tras haber cumplido esta condición, se convertirá en un participante de la campaña.
    UNIRSE AL CONCURSO
  • Opere de forma inteligente, gane un dispositivo
    Recargue su cuenta con al menos $500, regístrese en el concurso y tenga la oportunidad de ganar dispositivos móviles.
    UNIRSE AL CONCURSO
  • 100% de bonificación
    Su oportunidad única de obtener un bono del 100 % en su depósito
    OBTENER BONO
  • 55% de bonificación
    Solicite un bono del 55% en cada depósito
    OBTENER BONO
  • 30% de bonificación
    Reciba un bono del 30% cada vez que recargue su cuenta
    OBTENER BONO

Recommended Stories

Pronóstico del par EUR/USD y señales de trading para el 23 de marzo. Informe COT. Análisis detallado de los movimientos y operaciones del par. Una reacción absolutamente estándar del mercado a los resultados de la Fed.

El par de divisas EUR/USD volvió a crecer durante la tercera jornada bursátil de la semana. Anoche la Fed resumió su segunda reunión del año y el mercado estaba

Paolo Greco 06:43 2023-03-23 UTC+2

Pronóstico del par GBP/USD y señales de trading para el 23 de marzo. Informe COT. Análisis detallado de los movimientos y operaciones del par. ¡La libra se prepara para otro gran acontecimiento!

El par de divisas GBP/USD estuvo en modo de oscilación el miércoles, incluso en el marco temporal de una hora. De hecho, la libra esterlina también ha registrado fuertes ganancias

Paolo Greco 06:42 2023-03-23 UTC+2

EUR/USD: plan de negociación de la sesión estadounidense del 22 de marzo. Descripción general de las operaciones de la mañana. El EUR alcanza nuevos máximos

En mi artículo de la mañana, dirigí su atención a 1,0758 y recomendé tomar decisiones con este nivel en el punto de mira. Ahora, veamos el gráfico de 5 minutos

Miroslaw Bawulski 16:09 2023-03-22 UTC+2

Perspectiva del XAU/USD para el 22 de marzo de 2023

En un contexto de inflación alta, incertidumbre política y económica, y ante expectativas de decisiones blandas por parte de la Fed, las compras de activos defensivos —y en, bonos

Jurij Tolin 15:57 2023-03-22 UTC+2

Plan para operar con EURUSD el 22 de marzo de 2023

El EURUSD subió hasta 1,0780 intradiario el martes antes de encontrar una leve resistencia. Se ve que el par de la moneda única se cotiza cerca de 1,0775 en este

Oscar Ton 10:42 2023-03-22 UTC+2

Pronóstico del par EUR/USD y señales de operaciones para el 22 de marzo. Informe COT. Análisis detallado de los movimientos y operaciones del par. El dólar está listo para la reunión de la Fed.

El par de divisas EUR/USD volvió a crecer durante el segundo día de negociación de la semana. Como hemos dicho en los artículos paralelos, existen suficientes razones para el crecimiento

Paolo Greco 08:04 2023-03-22 UTC+2

Pronóstico del par GBP/USD y señales de operaciones para el 22 de marzo. Informe COT. Análisis detallado de los movimientos y operaciones del par. La libra cayó antes de las reuniones de los bancos centrales.

Sorprendentemente, el par GBP/USD mostró el martes una dirección de movimiento completamente distinta a la del par EUR/USD. Y como de costumbre, no había ninguna razón aparente para ello

Paolo Greco 08:04 2023-03-22 UTC+2

EUR/USD: plan de negociación para la sesión estadounidense del 21 de marzo de 2023

En mi pronóstico de la mañana, me enfoqué en el nivel de 1,0724 y sugerí tomar decisiones sobre ingresar al mercado desde allí. Echemos un vistazo al gráfico

Miroslaw Bawulski 16:10 2023-03-21 UTC+2

Perspectiva del GBP/USD para el 21 de marzo de 2023

Esta semana podría ser decisiva para el par GBP/USD: el miércoles (a las 18:00 GMT) se publicará la decisión de las tasas de interés de la Fed, y el jueves

Jurij Tolin 15:58 2023-03-21 UTC+2

Plan de negociación del GBP/USD para la sesión norteamericana del 20 de marzo de 2023. Descripción general de las operaciones de la mañana. Los toros afirman su fuerza en 1,2169

En mi revisión de la mañana, mencioné el nivel de 1,2169 como un posible punto de entrada. Analicemos lo que sucedió en el gráfico de 5 minutos. Una caída

Miroslaw Bawulski 16:58 2023-03-20 UTC+2
¿No puede hablar ahora mismo?
Ingrese su pregunta en el chat.