empty
 
 
05.12.2022 07:44 AM
Outlook and trading signals for GBP/USD on December 5. COT report. Analysis of market situation. The pound continues to seize the moment.

M5 chart of GBP/USD

This image is no longer relevant

GBP/USD also plummeted on Friday after the U.S. data and then sharply rose for no reason. Therefore, the pound showed almost identical movements to the euro. Everything we have mentioned in the article on the euro, is also true for the pound. It is also worth noting that the sterling is also not standing still, and is actively rising. The market continues to reduce positions on the dollar, which leads to the growth practically on a straight line, regardless of the macroeconomic statistics and fundamental background. Reminder: even the speech of Federal Reserve Chairman Jerome Powell last week was not dovish, so the pair should not rise at all. However, at the moment it can continue doing so for a long time. Fundamentals and macroeconomics are almost irrelevant now.

As for trading signals, the pound's situation was more interesting. Two buy signals near the level of 1.2259, both were false. In both cases the price went up 20 points, so Stop Loss orders should have been placed and there should be no loss. After that there was a buy signal near the level of 1.2185, which was quite dangerous to use, because strong US data had been released about half an hour before and it was more reasonable to expect the pair's decline, but not the rise. Nevertheless, those who opened a long position made a profit, as the quotes rose to 1.2259 and overcame that level. As a result, the day could even turn out to be profitable, in spite of the illogical movements.
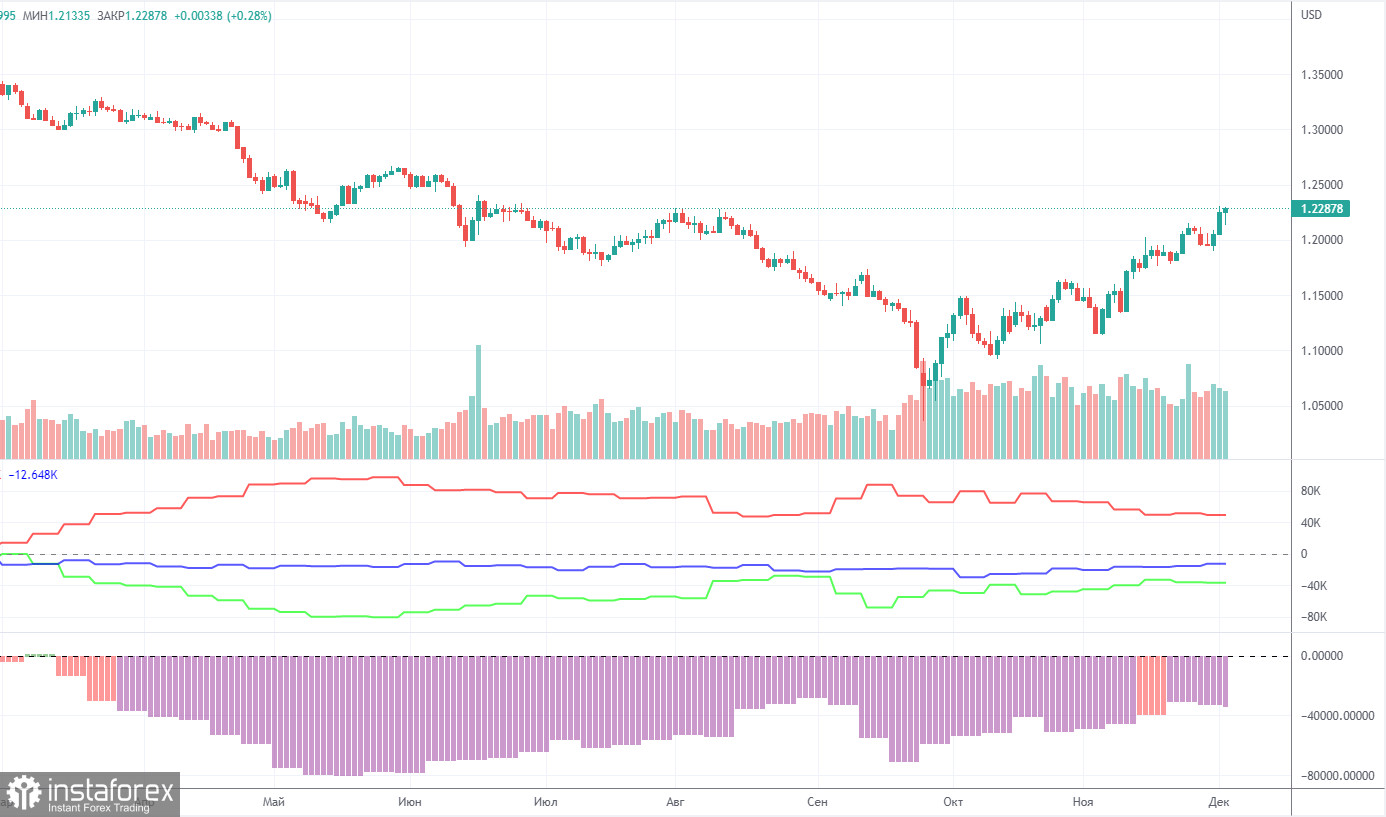
COT report

This image is no longer relevant

The latest COT report on the British pound indicated increasing bearish sentiment for the second consecutive week. In the given period, the non-commercial group closed 5,000 BUY contracts and 4,000 SELL contracts. Thus, the net position of non-commercial traders decreased by 1,000. The net position is growing during the last months, but the sentiment of the big players is still bearish, and the GBP is rising against the USD, but it is very difficult to answer the question why it does so. We don't exclude the option in which the pound could sharply fall in the near future. Take note that both major pairs are moving almost equally now, but the euro's net position is positive and even implies that the upward momentum will end soon, while it is negative for the pound... The non-commercial group now has a total of 62,000 short positions and 28,500 long positions. The difference, as you can see, is very large.

As for the total number of open Buy and Sell, the bulls have the advantage by 13,000. We are still skeptical about the British currency's growth in the long term, although there are technical reasons for it, but the foundation or geopolitics obviously do not imply such a solid strengthening of the pound.
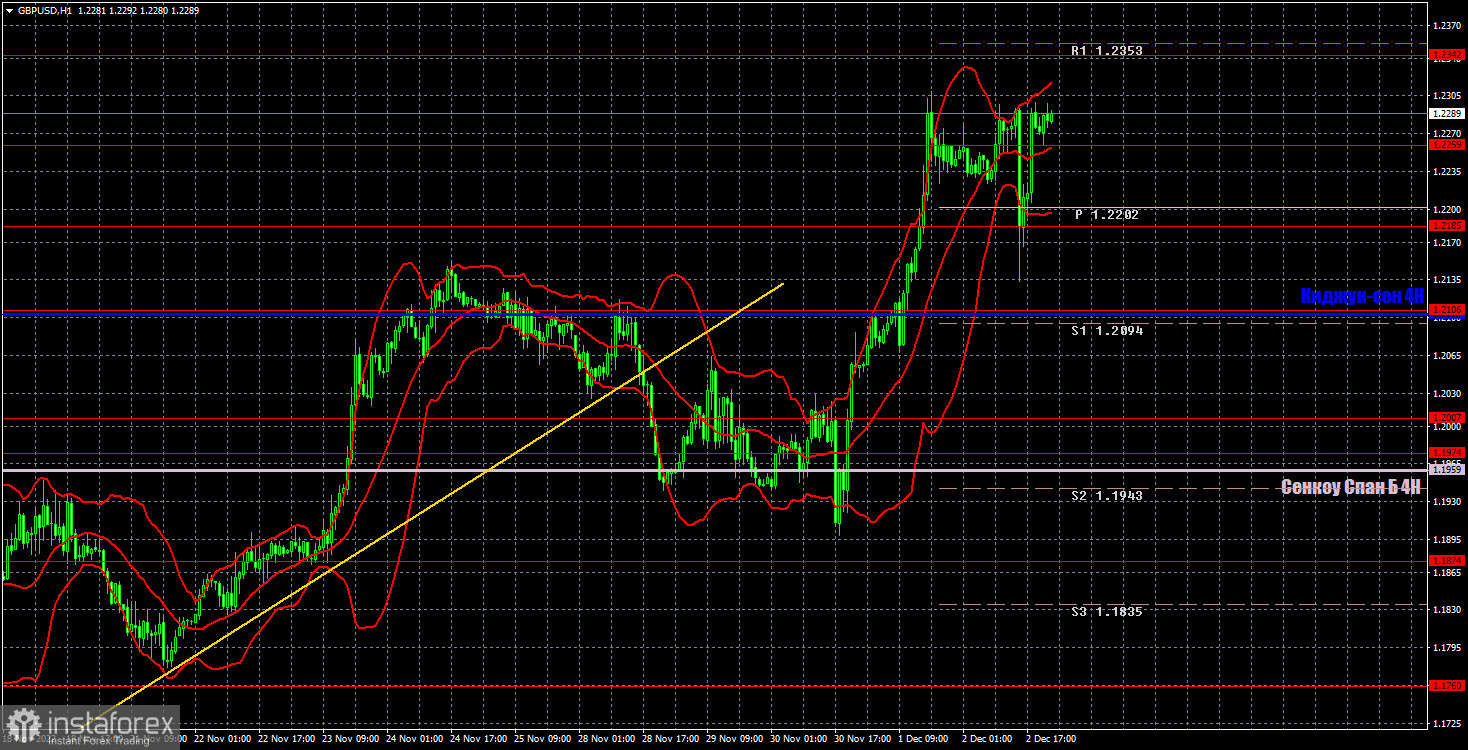
H1 chart of GBP/USD

This image is no longer relevant

The pair continues to trade very high and failed to start a downward correction on the one-hour chart. The most interesting thing is that the uptrend has resurfaced, but the trend line is no longer relevant, and there is no new trend line. Therefore, at this time, the pound can move in either direction with equal probability. On Monday, the pair may trade at the following levels: 1.1760, 1.1874, 1.1974-1.2007, 1.2106, 1.2185, 1.2259, 1.2342, 1.2429-1.2458. The Senkou Span B (1.1959) and Kijun Sen (1.2104) lines may also generate signals. Pullbacks and breakouts through these lines may produce signals as well. A Stop Loss order should be set at the breakeven point after the price passes 20 pips in the right direction. Ichimoku indicator lines may move during the day, which should be taken into account when determining trading signals. In addition, the chart does illustrate support and resistance levels, which could be used to lock in profits. On Monday, the UK is set to publish the index of business activity in the service sector, and traders will unlikely be surprised by its results. In America, the ISM Services Business Activity Index will be released, which has greater importance and weight in the eyes of traders.

What we see on the trading charts:

Price levels of support and resistance are thick red lines, near which the movement may end. They do not provide trading signals.

The Kijun-sen and Senkou Span B lines are the lines of the Ichimoku indicator, moved to the one-hour chart from the 4-hour one. They are strong lines.

Extreme levels are thin red lines from which the price bounced earlier. They provide trading signals.

Yellow lines are trend lines, trend channels, and any other technical patterns.

Indicator 1 on the COT charts reflects the net position size of each category of traders.

Indicator 2 on the COT charts reflects the net position size for the non-commercial group.

EURUSD
Euro vs US Dollar
Select timeframe
5
min
15
min
30
min
1
hour
4
hours
1
day
1
week
Start trade
Start trade
  • Grand Choice
    Contest by
    InstaForex
    InstaForex always strives to help you
    fulfill your biggest dreams.
    UNIRSE AL CONCURSO
  • Depósito al azar
    ¡Haga un depósito en su cuenta de $3,000 y obtenga $8000 más!
    ¡En Marzo, sorteamos $8000 dentro de la campaña Depósito afortunado!
    Obtenga la oportunidad de ganar depositando $3,000 en una cuenta de operaciones. Tras haber cumplido esta condición, se convertirá en un participante de la campaña.
    UNIRSE AL CONCURSO
  • Opere de forma inteligente, gane un dispositivo
    Recargue su cuenta con al menos $500, regístrese en el concurso y tenga la oportunidad de ganar dispositivos móviles.
    UNIRSE AL CONCURSO
  • 100% de bonificación
    Su oportunidad única de obtener un bono del 100 % en su depósito
    OBTENER BONO
  • 55% de bonificación
    Solicite un bono del 55% en cada depósito
    OBTENER BONO
  • 30% de bonificación
    Reciba un bono del 30% cada vez que recargue su cuenta
    OBTENER BONO

Recommended Stories

GBP/USD: plan de negociación para la sesión europea del 23 de marzo. Informe COT. La libra se prepara para subir tras la reunión del Banco de Inglaterra

Ayer, hubo bastantes excelentes puntos de entrada. Ahora, veamos el gráfico de 5 minutos y averigüemos qué sucedió realmente. Anteriormente, le pedí que prestara atención al nivel de 1,2232 para

Miroslaw Bawulski 16:38 2023-03-23 UTC+2

EUR/USD: plan de la sesión estadounidense para el 23 de marzo. Descripción general de las operaciones. El euro cae a 1,0929

En mi artículo de la mañana, dirigí su atención a 1,0929 y recomendé tomar decisiones con este nivel en el punto de mira. Ahora, veamos el gráfico de 5 minutos

Miroslaw Bawulski 16:19 2023-03-23 UTC+2

Pronóstico del par EUR/USD y señales de trading para el 23 de marzo. Informe COT. Análisis detallado de los movimientos y operaciones del par. Una reacción absolutamente estándar del mercado a los resultados de la Fed.

El par de divisas EUR/USD volvió a crecer durante la tercera jornada bursátil de la semana. Anoche la Fed resumió su segunda reunión del año y el mercado estaba

Paolo Greco 06:43 2023-03-23 UTC+2

Pronóstico del par GBP/USD y señales de trading para el 23 de marzo. Informe COT. Análisis detallado de los movimientos y operaciones del par. ¡La libra se prepara para otro gran acontecimiento!

El par de divisas GBP/USD estuvo en modo de oscilación el miércoles, incluso en el marco temporal de una hora. De hecho, la libra esterlina también ha registrado fuertes ganancias

Paolo Greco 06:42 2023-03-23 UTC+2

EUR/USD: plan de negociación de la sesión estadounidense del 22 de marzo. Descripción general de las operaciones de la mañana. El EUR alcanza nuevos máximos

En mi artículo de la mañana, dirigí su atención a 1,0758 y recomendé tomar decisiones con este nivel en el punto de mira. Ahora, veamos el gráfico de 5 minutos

Miroslaw Bawulski 16:09 2023-03-22 UTC+2

Perspectiva del XAU/USD para el 22 de marzo de 2023

En un contexto de inflación alta, incertidumbre política y económica, y ante expectativas de decisiones blandas por parte de la Fed, las compras de activos defensivos —y en, bonos

Jurij Tolin 15:57 2023-03-22 UTC+2

Plan para operar con EURUSD el 22 de marzo de 2023

El EURUSD subió hasta 1,0780 intradiario el martes antes de encontrar una leve resistencia. Se ve que el par de la moneda única se cotiza cerca de 1,0775 en este

Oscar Ton 10:42 2023-03-22 UTC+2

Pronóstico del par EUR/USD y señales de operaciones para el 22 de marzo. Informe COT. Análisis detallado de los movimientos y operaciones del par. El dólar está listo para la reunión de la Fed.

El par de divisas EUR/USD volvió a crecer durante el segundo día de negociación de la semana. Como hemos dicho en los artículos paralelos, existen suficientes razones para el crecimiento

Paolo Greco 08:04 2023-03-22 UTC+2

Pronóstico del par GBP/USD y señales de operaciones para el 22 de marzo. Informe COT. Análisis detallado de los movimientos y operaciones del par. La libra cayó antes de las reuniones de los bancos centrales.

Sorprendentemente, el par GBP/USD mostró el martes una dirección de movimiento completamente distinta a la del par EUR/USD. Y como de costumbre, no había ninguna razón aparente para ello

Paolo Greco 08:04 2023-03-22 UTC+2

EUR/USD: plan de negociación para la sesión estadounidense del 21 de marzo de 2023

En mi pronóstico de la mañana, me enfoqué en el nivel de 1,0724 y sugerí tomar decisiones sobre ingresar al mercado desde allí. Echemos un vistazo al gráfico

Miroslaw Bawulski 16:10 2023-03-21 UTC+2
¿No puede hablar ahora mismo?
Ingrese su pregunta en el chat.