To open long positions on EURUSD, you need:
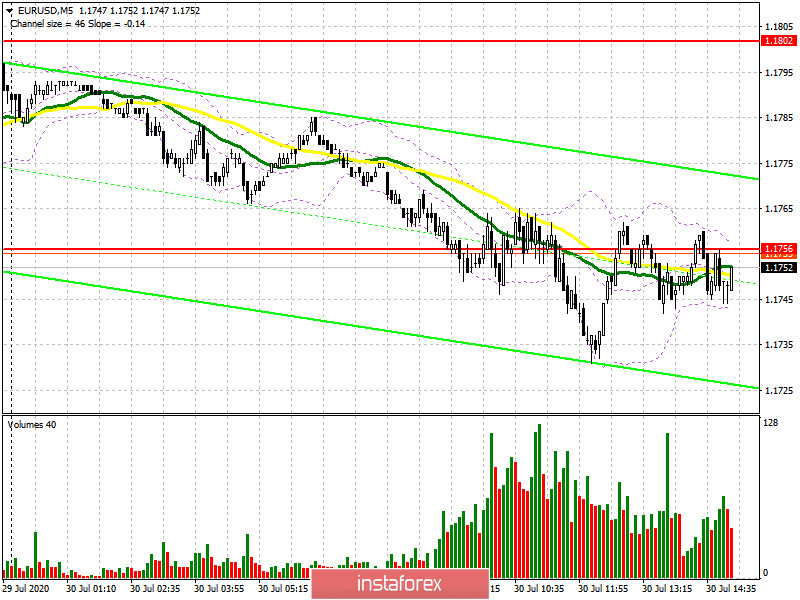
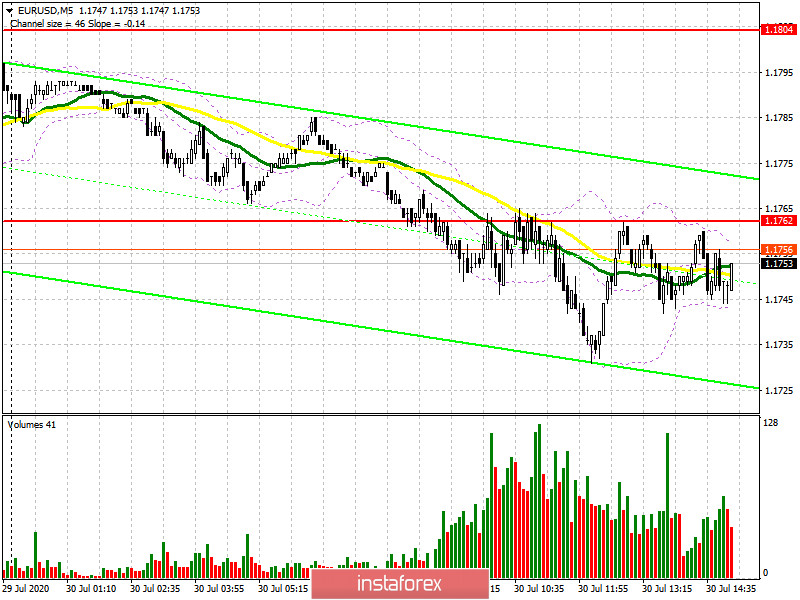
In the first half of the day, it was not possible to achieve a normal entry point for buying or selling the European currency. The level of 1.1756, which I was paying attention to, was completely blurred, resulting in a new resistance of 1.1762, which is clearly visible on the 5-minute chart.

Released fundamental data on the unemployment rate in the Eurozone in the first half of the day did not support the euro much, as it coincided with the forecasts of economists. Now, the further growth of EUR/USD directly depends on the breakdown of the resistance of 1.1762. Only the exit and consolidation at this level forms a good signal to open long positions that can return demand for the euro and lead to an update of the maximum of 1.1804, where I recommend fixing the profits. The longer-term goal is located near the maximum of 1.1830, where I recommend fixing the profits. In the scenario of a decline in EUR/USD in the second half of the day, the minimum of 1.1704 will act as support, however, you can open long positions from it only if a false breakout is formed. You can buy EUR/USD immediately on the rebound from the area of 1.1648 in the expectation of a correction of 25-30 points within the day.
To open short positions on EURUSD, you need:
Bears are still coping with their task, but for the full formation of the entry point to short positions from the level of 1.1762, it is necessary to form a false breakout. Only such a scenario will lead to a return of pressure on EUR/USD and a decrease in the area of the lower border of the channel 1.1704, where I recommend fixing the profits. The further target of the bears remains the area of 1.1648. If the demand for the euro returns in the afternoon, and the bears miss the level of 1.1762, it is best to consider new short positions after the update of the weekly high or immediately on a rebound from the resistance at 1.1830, counting on a correction of 25-30 points within the day.
Signals of indicators:
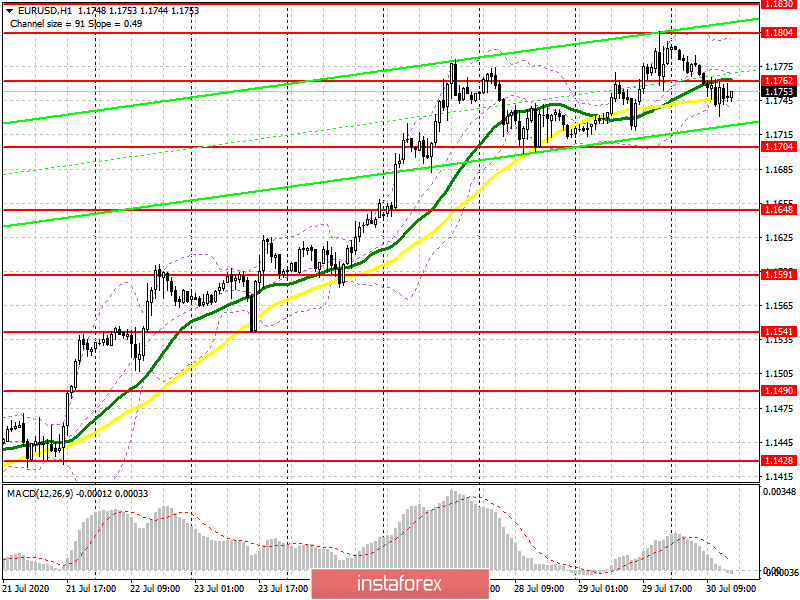
Moving averages
Trading is conducted in the area of 30 and 50 daily moving averages, which indicates market uncertainty in the short term.
Note: The period and prices of moving averages are considered by the author on the hourly chart H1 and differ from the general definition of the classic daily moving averages on the daily chart D1.
Bollinger Bands
A break in the upper limit of the indicator around 1.1804 will strengthen the demand for the euro. A breakdown of the lower border of the indicator in the area of 1.1740 will lead to a larger downward correction of the pair.
Description of indicators
- Moving average (moving average determines the current trend by smoothing out volatility and noise). Period 50. The graph is marked in yellow.
- Moving average (moving average determines the current trend by smoothing out volatility and noise). Period 30. The graph is marked in green.
- MACD indicator (Moving Average Convergence / Divergence - moving average convergence / divergence) Fast EMA period 12. Slow EMA period 26. SMA period 9
- Bollinger Bands (Bollinger Bands). Period 20
- Non-profit traders are speculators, such as individual traders, hedge funds, and large institutions that use the futures market for speculative purposes and meet certain requirements.
- Long non-commercial positions represent the total long open position of non-commercial traders.
- Short non-commercial positions represent the total short open position of non-commercial traders.
- Total non-commercial net position is the difference between short and long positions of non-commercial traders.