empty
 
 
19.07.2022 09:44 AM
คู่สกุลเงินปอนด์และดอลลาร์สหรัฐ ศักยภาพสำหรับความต่อเนื่องขาลง | วันที่ 19 เดือนกรกฎาคมปี2022

This image is no longer relevant


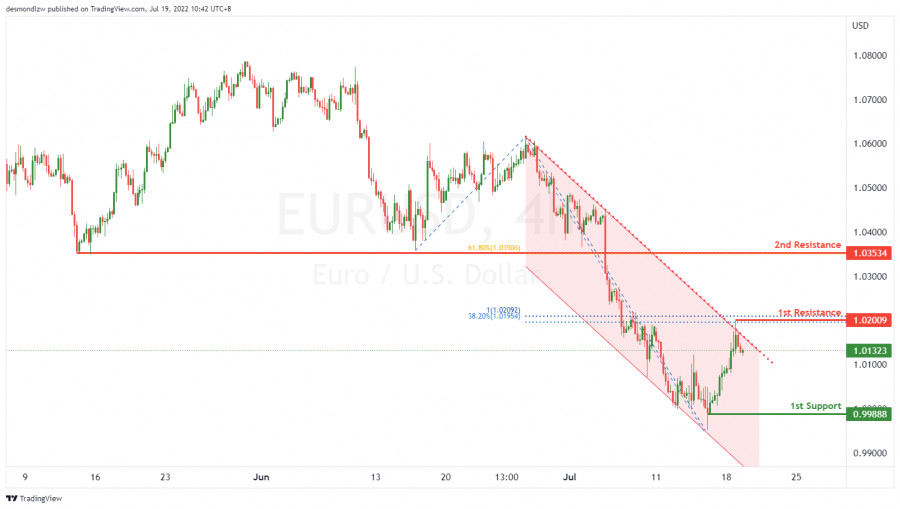
พวกเรามีส่วนเบี่ยงเบนขาลงที่ราคาจะปรับตัวลงจากแนวต้านอันดับแรกใน 1.02009 ในจุดสวิงสูงที่ตรงกับ 38.2% fibonacci retracement และ 100% fibonacci projection ไปยังแนวรับอันดับแรกใน 0.99888 ที่จุดสวิงต่ำพร้อมกับราคาที่เคลื่อนตัวภายในช่องทางแนวโน้มขาลงในกราฟระยะเวลา H4 นอกจากนั้นราคาอาจย้อนตัวออกจากแนวต้านอันดับแรกและปรับตัวขึ้นไปยังแนวต้านอันดับสองใน 1.03534 ในแนวต้านของจุดซ้อนทับที่ตรงกับ 61.8% fibonacci retracement

คำแนะนำการซื้อขาย

ตำแหน่งเข้า: 1.02009

เหตุผลของตำแหน่งเข้า:

Swing high in line with the 38.2% fibonacci retracement และ 100% fibonacci projection

ตำแหน่งทำกำไร: 0.99888

เหตุผลของตำแหน่งทำกำไร:Swing low

ตำแหน่งการหยุดก่อนขาดทุน: 1.03534

เหตุผลของตำแหน่งการหยุดก่อนขาดทุน:

Overlap resistance in line with the 61.8% fibonacci retracement.

EURUSD
Euro vs US Dollar
Select timeframe
5
min
15
min
30
min
1
hour
4
hours
1
day
1
week
Start trade
Start trade
คู่สกุลเงินปอนด์และดอลลาร์สหรัฐ (GBPUSD ) ศักยภาพความต่อเนื่องของขาลง | วันที่ 25 เดือนสิงหาคมปี 2022
ราคาดูเหมือนว่าจะอยู่ในโมเมนตัมขาลงและอยู่บนเส้น ichimoku cloud ในกราฟระยะเวลา H4 โดยมีการทดสอบกับแนวรับแรกที่ระดับ 1.1722 ที่มีจุดสวิงต่ำอยู่และตอนนี้ได้ย้อนตัวแล้วเรียบร้อย นอกจากนั้นหากราคาไม่สามารถทะลุผ่านแนวรับอันดับแรกใน 1.1722 ก็อาจย้อนกลับไปทดสอบกับแนวต้านอันดับแรกที่ 1.1920 ที่มี 38.2% ret.
ผู้เขียน: Dean Leo
04:10 2022-08-25 UTC--4
12430
คู่สกุลเงินดอลลาร์นิวซีแลนด์และดอลลาร์สหรัฐ (NZDUSD) ศักยภาพสำหรับการปรับตัวลงด้านล่าง | วันที่ 25 เดือนสิงหาคมปี 2022
พวกเรามีส่วนเบี่ยงเบนชาลงที่ราคาจะปรับตัวลงจากแนวต้านอันดับแรกที่ 0.6122 ที่มีแนวต้านของการย้อนกลับลงด้านล่างอยู่จนถึงแนวรับอันดับแรกในระดับ 0.60612 ที่มีแนวรับของจุดสวิงต่ำและ 161.8% fibonacci extension อยู่ในกราฟระยะเวลา H4 พร้อมกับราคาที่เคลื่อนตัวต่ำกว่าตัวบ่งชี้ ichimoku แน่นอนว่าราคาอาจทะลุผ่.
ผู้เขียน: Dean Leo
04:07 2022-08-25 UTC--4
13195
คู่สกุลเงิน ETHUSD ศักยภาพสำหรับการปรับตัวลงด้านล่าง | วันที่ 5 เดือนสิงหาคมปี 2022
พวกเรามีส่วนเบี่ยงเบนขาลงที่ราคาจะปรับตัวลงไปยังแนวรับอันดับแรกที่ระดับ 1642.25 ที่มีแนวรับของจุดย้อนกลับอยู่ในกราฟเวลา H4 พร้อมกับราคาที่กำลังเคลื่อนตัวผ่านช่องทางขาขึ้นและเคลื่อนตัวต่ำกว่าตัวบ่งชี้ ichimoku เมื่อมีการยืนยันขาลงที่ราคาได้ทะลุผ่านแนวรับอันดับแรกออกไปแล้ว พวกเราก็คาดว่าโมเมนตัมขาลงจ.
ผู้เขียน: Dean Leo
03:34 2022-08-25 UTC--4
12610
แสดงรายละเอียดเพิ่มเติม
  • Grand Choice
    Contest by
    InstaForex
    InstaForex always strives to help you
    fulfill your biggest dreams.
    เข้าร่วมการแข่งขัน
  • Chancy Deposit
    ฝากเงินในบัญชีของคุณใน $3,000 และรับ $1000 ไปเพิ่ม!
    ใน เมษายน ทางเราได้ออก$1000 ภายในแคมเปญ Chancy Deposit !
    คว้าโอกาสที่จะชนะด้วยการฝากเงิน $3,000 ไปในบัญชีเทรด เมื่อทำตามเงื่อนไขนี้แล้ว คุณก็จะกลายเป็นผู้เข้าร่วมแคมเปญ
    เข้าร่วมการแข่งขัน
  • เทรดให้ดีแล้วคว้ารางวัล
    เติมเงินในบัญชีของคุณอย่างน้อย $500 สมัครเข้าร่วมการแข่งขัน และลุ้นรับรางวัลอุปกรณ์ติดต่อสื่อสารแบบพกพา
    เข้าร่วมการแข่งขัน
  • โบนัส 100%
    โอกาสพิเศษของคุณในการรับโบนัส 100% จากเงินฝากของคุณ
    รับโบนัส
  • โบนัส 55%
    สมัครรับโบนัส 55% สำหรับการฝากทุกครั้ง
    รับโบนัส
  • โบนัส 30%
    รับโบนัส 30% ทุกครั้งที่คุณเติมเงินในบัญชีของคุณ
    รับโบนัส

Recommended Stories

DXY, H4 | Strong descending trendline ?

The DXY chart displays bearish momentum, with prices below a significant descending trendline. The first support level at 101.89, a swing low support, coincides with a 78.60% Fibonacci retracement level

Dean Leo 08:11 2023-03-31 UTC+2

DXY, H4 | Strong descending trendline ?

The DXY index is currently displaying strong bearish momentum, trading below a significant descending trend line, indicating further potential for price drops. If the trend continues, the index could decline

Dean Leo 07:50 2023-03-30 UTC+2

US500, H4 | Ascending trendline ?

US500 chart is bullish, with price above a major ascending trend line, potential for bullish continuation to first resistance. First support level at 3903.06 is a strong multi-swing low support

Dean Leo 08:04 2023-03-28 UTC+2

WIT(OIL), Day | Strong descending trendline ?

WTI oil prices have turned bearish as they fell below a crucial support level. The chart indicates that the momentum has shifted to the downside, signaling a potential further decline

Dean Leo 07:46 2023-03-27 UTC+2

USDJPY, H4 | Strong descending trendline ?

The USD/JPY pair currently has a weak momentum with low confidence due to its position below a major descending trend line, indicating possible bearish momentum. Breaking off from the first

Dean Leo 06:07 2023-03-24 UTC+2

USDCAD, H4 | Respected descending trendline ?

The charts indicate that the USD/CAD currency pair is currently experiencing a bearish momentum, with price situated below a significant descending trend line. As such, it is likely that

Dean Leo 06:55 2023-03-23 UTC+2

USD/JPY, H4 | Break out trendline?

The USD/JPY chart currently reflects a bullish momentum as it is trading above a significant ascending trend line, indicating potential for further bullish movement. In case the price manages

Dean Leo 06:37 2023-03-22 UTC+2

AUDUSD, H4 | Break out trendline?

Currently, the AUD/USD chart reflects bullish momentum, indicated by the break above a descending resistance line and the crossing above the Ichimoku cloud. The potential for continued bullish movement towards

Dean Leo 07:53 2023-03-21 UTC+2

EURUSD, Day | Potential reversel?

The EUR/USD pair has bullish momentum and may move towards the 1st resistance level. Pullback support at 1.0478, coinciding with the 38.20% Fibonacci retracement level, is currently supporting the price

Dean Leo 09:44 2023-03-20 UTC+2

GBPUSD, H4 | Potential reversel from trendline?

The GBP/USD chart currently exhibits bearish momentum, as the price remains below a significant descending trend line. This indicates that the currency pair may undergo further downward pressure

Dean Leo 08:05 2023-03-17 UTC+2
หากไม่สะดวกคุยในตอนนี้
ระบุคำถามไว้ได้ใน แชท.