empty
 
 
28.11.2022 11:05 AM
Technical Analysis of EUR/USD for November 28, 2022

Technical Market Outlook:

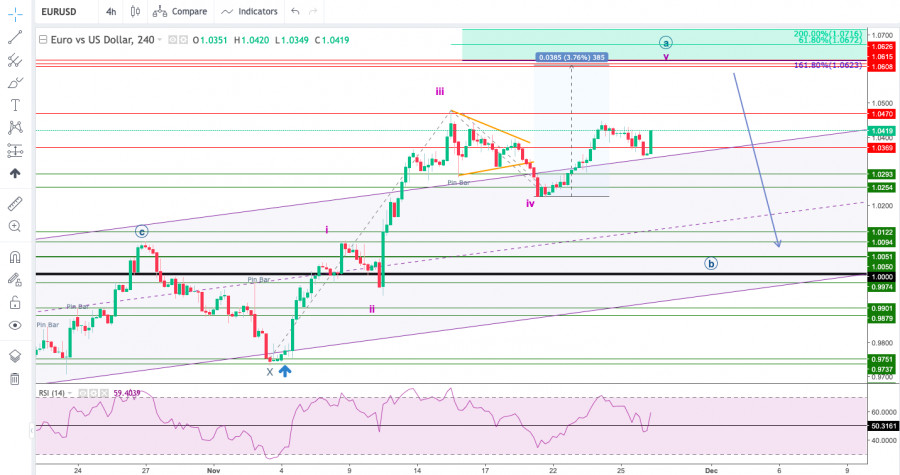
The EUR/USD pair has been seen moving up towards the next target for bulls seen at 161% Fibonacci extension located at 1.0623. The last local pull-back had tested the nearest technical support seen at 1.0254 and since then the bulls are still pushing to the upside. The strong and positive momentum supports the short term bullish outlook for EUR on the H4 time frame chart. The bulls still need to complete the wave v of the wave A to the upside as a part of the ABC-X-ABC complex corrective structure, so a breakout above the level of 1.0480 is needed soon.

This image is no longer relevant

Weekly Pivot Points:

WR3 - 1.04855

WR2 - 1.04310

WR1 - 1.04122

Weekly Pivot - 1.03765

WS1 - 1.03577

WS2 - 1.03220

WS3 - 1.02675

Trading Outlook:

The EUR had made a new multi-decade low at the level of 0.9538, so as long as the USD is being bought all across the board, the down trend will continue towards the new lows. In the mid-term, the key technical resistance level is located at 1.0389 and only if this level is clearly violated, the down trend might be considered terminated. Please notice, there is plenty of room to the downside for the EUR to go, all of the potential technical support level are very old and might not be much reliable anymore.

Please be aware, that any sustained breakout below the technical support seen at 0.9737 will extend the down move even more and will put the level of 0.9669 in view. In the longer term, the key technical resistance level is located at 1.0789 (swing high from May 30th), so the bulls still have a long road to take before the down trend reversal is confirmed. It looks like the simple corrective ABC cycle might evolve into more complex and time consuming ABC-X-ABC cycle.

EURUSD
Euro vs US Dollar
Select timeframe
5
min
15
min
30
min
1
hour
4
hours
1
day
1
week
Start trade
Start trade
  • Grand Choice
    Contest by
    InstaForex
    InstaForex always strives to help you
    fulfill your biggest dreams.
    เข้าร่วมการแข่งขัน
  • Chancy Deposit
    ฝากเงินในบัญชีของคุณใน $3,000 และรับ $8000 ไปเพิ่ม!
    ใน มีนาคม ทางเราได้ออก$8000 ภายในแคมเปญ Chancy Deposit !
    คว้าโอกาสที่จะชนะด้วยการฝากเงิน $3,000 ไปในบัญชีเทรด เมื่อทำตามเงื่อนไขนี้แล้ว คุณก็จะกลายเป็นผู้เข้าร่วมแคมเปญ
    เข้าร่วมการแข่งขัน
  • เทรดให้ดีแล้วคว้ารางวัล
    เติมเงินในบัญชีของคุณอย่างน้อย $500 สมัครเข้าร่วมการแข่งขัน และลุ้นรับรางวัลอุปกรณ์ติดต่อสื่อสารแบบพกพา
    เข้าร่วมการแข่งขัน
  • โบนัส 100%
    โอกาสพิเศษของคุณในการรับโบนัส 100% จากเงินฝากของคุณ
    รับโบนัส
  • โบนัส 55%
    สมัครรับโบนัส 55% สำหรับการฝากทุกครั้ง
    รับโบนัส
  • โบนัส 30%
    รับโบนัส 30% ทุกครั้งที่คุณเติมเงินในบัญชีของคุณ
    รับโบนัส

Recommended Stories

BTCUSD, H4 | Potential Reversal from a key level ?

The BTC/USD chart is currently bearish, indicating potential further price drops. The first resistance level at 28342 could prompt a bearish reaction towards the first support level at 26557. This

Dean Leo 06:10 2023-03-24 UTC+2

XAUUSD, H4 | Continue to 1st Support?

The XAU/USD chart currently has a bearish momentum, with potential for a bearish reaction off the first resistance level at 2007 and a drop towards the first support level

Dean Leo 06:09 2023-03-24 UTC+2

Trading Signal for GOLD (XAU/USD) for March 24 - 27, 2023: sell below $1,986 or in case of pullback at $2,002 (8/8 Murray - double top)

On the 4-hour chart, we can see the formation of a double top which could be a sign of a probable change in trend. If this scenario occurs, gold should

Dimitrios Zappas 05:19 2023-03-24 UTC+2

Forecast for EUR/USD on March 24, 2023

Yesterday, the euro desperately tried to climb above the MACD line on the daily chart, as well as on Wednesday, but at the end of the day, it closed below

Laurie Bailey 04:38 2023-03-24 UTC+2

Forecast for GBP/USD on March 24, 2023

The pound was able to overcome the resistance of the MACD indicator line on the daily chart, but could not hold steady above it. In today's Asian session, with

Laurie Bailey 04:38 2023-03-24 UTC+2

Forecast for USD/JPY on March 24, 2023

This morning, the price reached the target support on the embedded price hyperchannel line of the monthly chart at 130.18. To achieve this goal, the price had to push through

Laurie Bailey 04:38 2023-03-24 UTC+2

Technical analysis of GBP/USD for March 23, 2023

The GBP/USD pair has faced strong support at the level of 1.2173 because resistance became support. So, the strong resistance has been already faced at the level of 1.2173

Mourad El Keddani 23:53 2023-03-23 UTC+2

EUR/USD reaches upper median line as expected

EUR/USD climbed as much as 1.0929 today where it has found resistance again. Now, it is trading lower at 1.0895 at the time of writing. The bias remains bullish despite

Ralph Shedler 18:40 2023-03-23 UTC+2

GBP/USD: rising wedge in progress

The GBP/USD pair registered a strong leg higher in the short term and now is trading at 1.2314 at the time of writing. Now, it stands right below important upside

Ralph Shedler 18:39 2023-03-23 UTC+2

Technical analysis of EUR/USD for March 23, 2023

The bullish bias will be suggested for today, supported by the EMA100 that carries the price from above, taking into consideration that breaking 1.0819 will stop the expected rise

Mourad El Keddani 17:28 2023-03-23 UTC+2
หากไม่สะดวกคุยในตอนนี้
ระบุคำถามไว้ได้ใน แชท.