empty
 
 
28.11.2022 11:05 AM
Technical Analysis of EUR/USD for November 28, 2022

Technical Market Outlook:

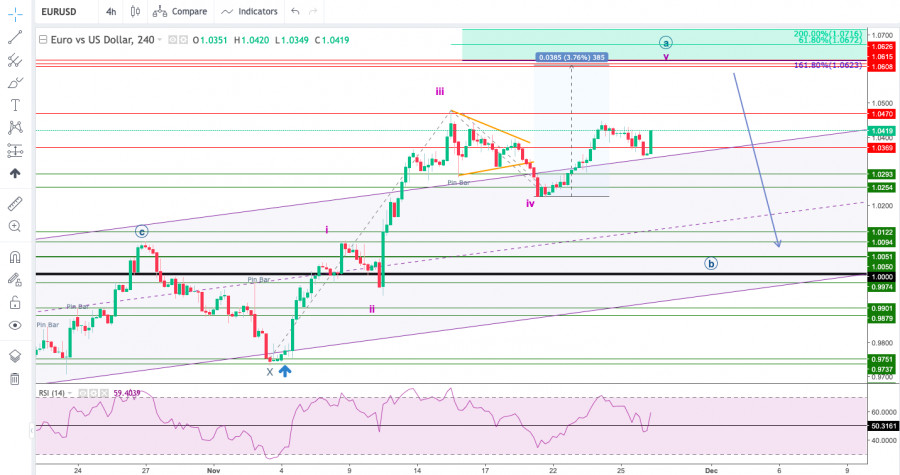
The EUR/USD pair has been seen moving up towards the next target for bulls seen at 161% Fibonacci extension located at 1.0623. The last local pull-back had tested the nearest technical support seen at 1.0254 and since then the bulls are still pushing to the upside. The strong and positive momentum supports the short term bullish outlook for EUR on the H4 time frame chart. The bulls still need to complete the wave v of the wave A to the upside as a part of the ABC-X-ABC complex corrective structure, so a breakout above the level of 1.0480 is needed soon.

This image is no longer relevant

Weekly Pivot Points:

WR3 - 1.04855

WR2 - 1.04310

WR1 - 1.04122

Weekly Pivot - 1.03765

WS1 - 1.03577

WS2 - 1.03220

WS3 - 1.02675

Trading Outlook:

The EUR had made a new multi-decade low at the level of 0.9538, so as long as the USD is being bought all across the board, the down trend will continue towards the new lows. In the mid-term, the key technical resistance level is located at 1.0389 and only if this level is clearly violated, the down trend might be considered terminated. Please notice, there is plenty of room to the downside for the EUR to go, all of the potential technical support level are very old and might not be much reliable anymore.

Please be aware, that any sustained breakout below the technical support seen at 0.9737 will extend the down move even more and will put the level of 0.9669 in view. In the longer term, the key technical resistance level is located at 1.0789 (swing high from May 30th), so the bulls still have a long road to take before the down trend reversal is confirmed. It looks like the simple corrective ABC cycle might evolve into more complex and time consuming ABC-X-ABC cycle.

EURUSD
Euro vs US Dollar
Select timeframe
5
min
15
min
30
min
1
hour
4
hours
1
day
1
week
Start trade
Start trade
  • Grand Choice
    Contest by
    InstaForex
    InstaForex always strives to help you
    fulfill your biggest dreams.
    THAM GIA CUỘC THI
  • Tiền gửi lần truy cập
    Ký quỹ tài khoản của bạn với $3000 và nhận được $8000 nhiều hơn!
    Trong Tháng 3 chúng tôi xổ $8000 trong chiến dịch Chancy Deposit!
    Có được một cơ hội giành chiến thắng bằng việc ký quỹ $3000 vào một tài khoản giao dịch. Đáp ứng được điều kiện này, bạn trở thành một người tham gia chiến dịch.
    THAM GIA CUỘC THI
  • Giao dịch khôn ngoan, thành công
    Nạp tiền vào tài khoản của bạn với ít nhất $ 500, đăng ký cuộc thi và có cơ hội giành được các thiết bị di động.
    THAM GIA CUỘC THI
  • 100% tiền thưởng
    Cơ hội duy nhất của bạn để nhận 100% tiền thưởng khi gửi tiền
    NHẬN THƯỞNG
  • 55% Tiền thưởng
    Đăng ký tiền thưởng 55% cho mỗi lần gửi tiền của bạn
    NHẬN THƯỞNG
  • 30% tiền thưởng
    Nhận 30% tiền thưởng mỗi khi bạn nạp tiền vào tài khoản của mình
    NHẬN THƯỞNG

Recommended Stories

Technical Analysis of Daily Price Movement of United States Dollar Currency index, Monday March 27 2023.

If we look on the daily chart of USD index, then there will be a few interesting things: 1. There is a deviation between price movement with Awesome Oscillator indicator

Arief Makmur 06:23 2023-03-27 UTC+2

Technical Analysis of Daily Price Movement Gold Commodity Asset, Monday March 27 2023.

On the daily chart, Gold commodity asset seems appear after broken below the level of 1959,23. Gold will return corrected below where this things confirmed by: 1. The Appearance

Arief Makmur 06:23 2023-03-27 UTC+2

Forecast for EUR/USD on March 27, 2023

The euro closed Friday with a 71-point drop. The price tried to get out of the target range of 1.0758/87, but it still ended the day within that range

Laurie Bailey 04:45 2023-03-27 UTC+2

Forecast for GBP/USD on March 27, 2023

The British pound fell by 55 points on Friday, breaking the support of the MACD indicator line. The price showed that the last two breakthroughs above this line on Wednesday

Laurie Bailey 04:45 2023-03-27 UTC+2

Forecast for AUD/USD on March 27, 2023

After the Australian dollar failed to break through the resistance at 0.6730 on March 22 and 23, it attacked the support at 0.6640 on Friday, March 24 . The Marlin

Laurie Bailey 04:45 2023-03-27 UTC+2

Technical analysis of GBP/USD for March 26, 2023

The GBP/USD pair broke resistance at 1.2135 which turned into strong support yesterday. This level coincides with 38.2% of Fibonacci retracement which is expected to act as major support today

Mourad El Keddani 22:42 2023-03-26 UTC+2

Technical analysis of EUR/USD for March 26, 2023

The EUR/USD pair rallied upwards strongly yesterday to breach the bearish channel's resistance and settles above it, opening the way to turn to the upside on the intraday and short-term

Mourad El Keddani 22:36 2023-03-26 UTC+2

Technical analysis on NZDUSD for week ending March 24th, 2023.

NZDUSD made another attempt this past week to break above the neckline resistance of 0.6265-0.6275. This was the second attempt and traders witnessed another failure and rejection. Price

Alexandros Yfantis 13:01 2023-03-26 UTC+2

Technical analysis on EURUSD for week ending March 24th, 2023.

EURUSD made new higher highs last week above 1.09 but bulls failed to hold their gains as price turned lower towards 1.0760. As we mentioned in previous posts

Alexandros Yfantis 12:45 2023-03-26 UTC+2

March 24, 2023 : EUR/USD daily technical review and trading opportunities.

The price level of 1.0800 remained a significant resistance level to offer SELL opportunities until the current upside movement was expressed. The next target is located around 1.1000 where

Mohamed Samy 16:55 2023-03-24 UTC+2
Không thể nói chuyện ngay bây giờ?
Đặt câu hỏi của bạn trong phần trò chuyện.