empty
 
 
30.11.2022 04:02 PM
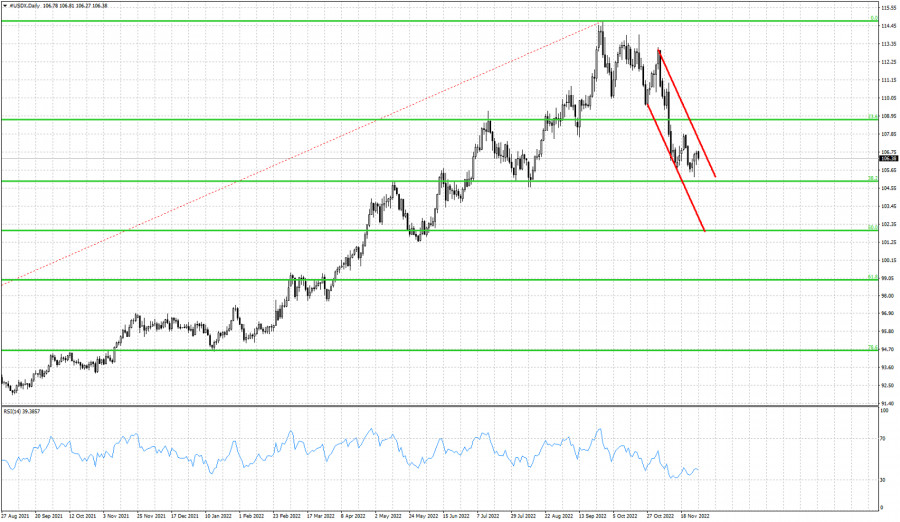
Dollar index remains vulnerable to making new lower lows.

This image is no longer relevant

Green lines- Fibonacci retracements

Red lines- bearish channel

The Dollar index is still in a bearish short-term trend. Price continues making lower lows and lower highs inside the short-term bearish channel. Price is at 106.40 just above the 38% Fibonacci retracement level of the entire rise from 89 to 114.75. After the latest lower low in price, the RSI did not provide new lows, but a bullish divergence. This does not mean that the down trend is over. A new lower low remains highly probable as long as price is inside the bearish channel. Next downside target is at 104.95-105 as long as price is below 107.35. If a new bullish divergence is seen, then the chances for a bounce and reversal to the upside will increase. The 38% Fibonacci retracement around 105 is very important technical support and I expect a strong bounce from this level.

EURUSD
Euro vs US Dollar
Select timeframe
5
min
15
min
30
min
1
hour
4
hours
1
day
1
week
Start trade
Start trade
  • Grand Choice
    Contest by
    InstaForex
    InstaForex always strives to help you
    fulfill your biggest dreams.
    เข้าร่วมการแข่งขัน
  • Chancy Deposit
    ฝากเงินในบัญชีของคุณใน $3,000 และรับ $8000 ไปเพิ่ม!
    ใน มีนาคม ทางเราได้ออก$8000 ภายในแคมเปญ Chancy Deposit !
    คว้าโอกาสที่จะชนะด้วยการฝากเงิน $3,000 ไปในบัญชีเทรด เมื่อทำตามเงื่อนไขนี้แล้ว คุณก็จะกลายเป็นผู้เข้าร่วมแคมเปญ
    เข้าร่วมการแข่งขัน
  • เทรดให้ดีแล้วคว้ารางวัล
    เติมเงินในบัญชีของคุณอย่างน้อย $500 สมัครเข้าร่วมการแข่งขัน และลุ้นรับรางวัลอุปกรณ์ติดต่อสื่อสารแบบพกพา
    เข้าร่วมการแข่งขัน
  • โบนัส 100%
    โอกาสพิเศษของคุณในการรับโบนัส 100% จากเงินฝากของคุณ
    รับโบนัส
  • โบนัส 55%
    สมัครรับโบนัส 55% สำหรับการฝากทุกครั้ง
    รับโบนัส
  • โบนัส 30%
    รับโบนัส 30% ทุกครั้งที่คุณเติมเงินในบัญชีของคุณ
    รับโบนัส

Recommended Stories

Forex forecast 03/27/2023 GBP/USD, EUR/USD, USD/JPY and Oil from Sebastian Seliga

Let's take a look at the technical picture of GBP/USD, EUR/USD, USD/JPY

Sebastian Seliga 11:24 2023-03-27 UTC+2

GBP/USD: technical analysis on March 27, 2023

Hello, dear traders! In the 1-hour time frame, GBP/USD settled below the ascending trend corridor and the 1.2238 mark on Friday. The price may drop to the 127.2% Fibonacci level

Samir Klishi 10:34 2023-03-27 UTC+2

Video market update for March 27, 2023

Potential for the breakout on the BTC/USD

Petar Jacimovic 09:50 2023-03-27 UTC+2

Indicator analysis: Daily review of GBP/USD on March 27, 2023

The pound-dollar pair may move upward from the level of 1.2230 (closing of Friday's daily candle) to 1.2294, the 76.4% pullback level (blue dotted line). From here, the price

Stefan Doll 09:50 2023-03-27 UTC+2

Indicator analysis: Daily review of EUR/USD on March 27, 2023

The euro-dollar pair may move downward from the level of 1.0760 (closing of Friday's daily candle) to 1.0713, the 38.2% pullback level (red dotted line). When testing this level

Stefan Doll 09:40 2023-03-27 UTC+2

Technical analysis of GBP/USD for March 27-31, 2023

GBP/USD may continue an upward movement this week, starting from the closing of last week's candle to the upper fractal. Then, upon testing this level, the pair will head towards

Stefan Doll 09:40 2023-03-27 UTC+2

Technical analysis of EUR/USD for March 27-31, 2023

EUR/USD is likely to continue its upward movement this week, rising from the closing of the last weekly candle to the 76.4% retracement level. Then, upon reaching this price

Stefan Doll 09:33 2023-03-27 UTC+2

Analysis of Gold for March 27,.2023 - Key support zone at the price of $1.968 on the test

Technical analysis: Gold has been trading downside this morning but I see that support zone at the price of $1.967 is on the test. In case of the rejection

Petar Jacimovic 09:12 2023-03-27 UTC+2

USD/CAD analysis for March 27, 2023 - Failed breakout of the upside and potential for the downside movement

Technical analysis: USD/CAD has been trading downside and in the background I sad failed breakout of the range to the upside, which is good sign for the further downside movement

Petar Jacimovic 09:03 2023-03-27 UTC+2

Technical Analysis of GBP/USD for March 27, 2023

Technical Market Outlook: The GBP/USD pair has broken below the short-term trend line support and made a new local low at the level of 1.2189 ( at the time

Sebastian Seliga 08:55 2023-03-27 UTC+2
หากไม่สะดวกคุยในตอนนี้
ระบุคำถามไว้ได้ใน แชท.