empty
 
 
27.01.2023 07:05 PM
Technical analysis of GBP/USD for January 27, 2023

This image is no longer relevant

Overview:

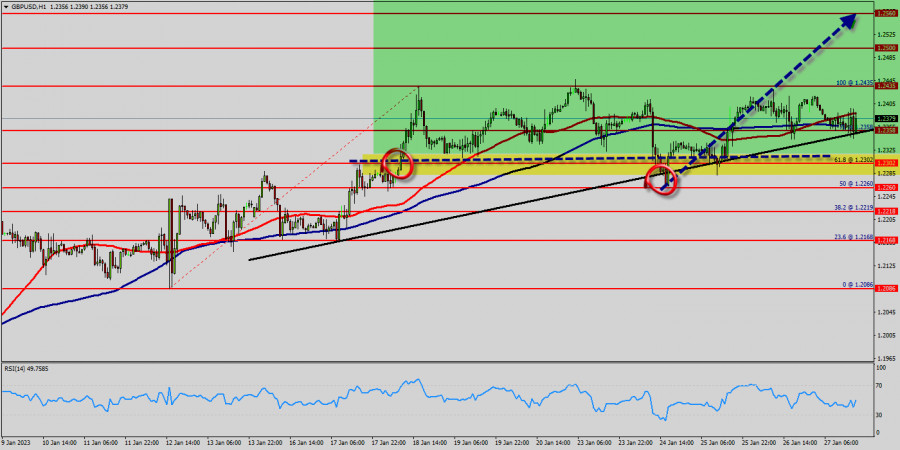
The bullish trend is currently very strong for the GBP/USD pair. As long as the price remains above the weekly support at 1.2260, you could try to take advantage of the bullish rally. The first bullish objective is located at 1.2435. The bullish momentum would be revived by a break in this resistance. Buyers would then use the next resistance located at 1.2500 USD as an objective. Crossing it would then enable buyers to target 1.2500 USD. Be careful, given the powerful bearish rally underway, excesses could lead to a short-term rebound. If this is the case, remember that trading against the trend may be riskier. It would seem more appropriate to wait for a signal indicating reversal of the trend.

Today, the GBP/USD pair has broken resistance at the level of 1.2260 which acts as support now. Thus, the pair has already formed minor support at 1.2260. The strong support is seen at the level of 1.2218 because it represents the weekly support 1. Equally important, the RSI and the moving average (100) are still calling for an uptrend. Therefore, the market indicates a bullish opportunity at the level of 1.2260 on the hourly chart. Also, if the trend is buoyant, then the currency pair strength will be defined as following: GBP is in an uptrend and USD is in a downtrend. Buy above the minor support of 1.2260 with the first target at 1.2358 (this price is coinciding with the ratio of 78% Fibonacci), and continue towards 1.2435 (the weekly resistance 1 - double top - last bullish wave).

On the other hand, if the price closes below the minor support, the best location for the stop loss order is seen below 1.2435; hence, the price will fall into the bearish market in order to go further towards the strong support at 1.2302 to test it again. Furthermore, the level of 1.2260 will form a double bottom.

Bearish outlook : The current rise will remain within a framework of correction. However, if the pair fails to pass through the level of 1.2435, the market will indicate a bearish opportunity below the strong resistance level of 1.2435 (the level of 1.2435 coincides with the double top too). Since there is nothing new in this market, it is not bullish yet. Sell deals are recommended below the level of 1.2435 with the first target at 1.2302. If the trend breaks the support level of 1.2302, the pair is likely to move downwards continuing the development of a bearish trend to the level 1.2219

However, In the very short term, the general bearish sentiment is confirmed by technical indicators. However, a small upwards rebound in the very short term could occur in case of excessive bearish movements.

GBPUSD
Great Britain Pound vs US Dollar
Select timeframe
5
min
15
min
30
min
1
hour
4
hours
1
day
1
week
Start trade
Start trade
  • Grand Choice
    Contest by
    InstaForex
    InstaForex always strives to help you
    fulfill your biggest dreams.
    เข้าร่วมการแข่งขัน
  • Chancy Deposit
    ฝากเงินในบัญชีของคุณใน $3,000 และรับ $8000 ไปเพิ่ม!
    ใน มีนาคม ทางเราได้ออก$8000 ภายในแคมเปญ Chancy Deposit !
    คว้าโอกาสที่จะชนะด้วยการฝากเงิน $3,000 ไปในบัญชีเทรด เมื่อทำตามเงื่อนไขนี้แล้ว คุณก็จะกลายเป็นผู้เข้าร่วมแคมเปญ
    เข้าร่วมการแข่งขัน
  • เทรดให้ดีแล้วคว้ารางวัล
    เติมเงินในบัญชีของคุณอย่างน้อย $500 สมัครเข้าร่วมการแข่งขัน และลุ้นรับรางวัลอุปกรณ์ติดต่อสื่อสารแบบพกพา
    เข้าร่วมการแข่งขัน
  • โบนัส 100%
    โอกาสพิเศษของคุณในการรับโบนัส 100% จากเงินฝากของคุณ
    รับโบนัส
  • โบนัส 55%
    สมัครรับโบนัส 55% สำหรับการฝากทุกครั้ง
    รับโบนัส
  • โบนัส 30%
    รับโบนัส 30% ทุกครั้งที่คุณเติมเงินในบัญชีของคุณ
    รับโบนัส

Recommended Stories

March 24, 2023 : EUR/USD daily technical review and trading opportunities.

The price level of 1.0800 remained a significant resistance level to offer SELL opportunities until the current upside movement was expressed. The next target is located around 1.1000 where

Mohamed Samy 16:55 2023-03-24 UTC+2

March 24, 2023 : EUR/USD Intraday technical analysis and trading plan.

Price action around the key-level of (1.0550-1.0600) was quite bullish. That's why, further bullish continuation towards 1.0800 was demonstrated. Moreover, more bullish advancement towards the nearest supply zone around 1.1150-1.1200

Mohamed Samy 16:54 2023-03-24 UTC+2

March 24, 2023 : GBP/USD Intraday technical analysis and significant key-levels.

The GBPUSD bulls failed to record a new high above 1.2200. Instead, a descending high was established around the same price level. Bearish pullback pursued towards the price levels

Mohamed Samy 16:53 2023-03-24 UTC+2

GBP/USD: reversal pattern activated

The GBP/USD pair crashed in the short term as the Dollar Index rebounded. Yesterday, I talked about exhausted buyers and about a Rising Wedge pattern. The pair's trading at 1.2225

Ralph Shedler 16:48 2023-03-24 UTC+2

Trading Signal for USD/JPY for March 24 - 27, 2023: buy above 130.10 (3/8 Murray - rebound)

Early in the US session, the Japanese Yen is trading around 130.10 bouncing after reaching a low around 129.62, the level which coincides with 3/8 Murray (129.68). Japanese yen like

Dimitrios Zappas 15:14 2023-03-24 UTC+2

EUR/USD: technical analysis on March 24, 2023

Hello, dear traders! On Thursday, EUR/USD reversed to the downside and almost approached the lower line of the ascending trend corridor, which indicates a bullish bias. Consolidation below the corridor

Samir Klishi 11:25 2023-03-24 UTC+2

GBP/USD: technical analysis on March 24, 2023. BoE raises rates for 11th time

Hello, dear traders! On the 1-hour chart, GBP/USD bounced off 1.2342, reversed to the downside, and headed toward 1.2238 and the lower limit of the ascending corridor. This line illustrates

Samir Klishi 11:25 2023-03-24 UTC+2

Forex forecast 03/24/2023 GBP/USD, USD/CHF, USD/CAD and Bitcoin from Sebastian Seliga

Let's take a look at the technical picture of GBP/USD, USD/CHF, USD/CAD and Bitcoin

Sebastian Seliga 09:59 2023-03-24 UTC+2

Video market update for March 24, 2023

Potential for the rally on USD/JPY

Petar Jacimovic 09:35 2023-03-24 UTC+2

USD/JPY analysis for March 24, 2023 - Potential for the rally

Technical analysis: USD/JPY has been trading downside in the background but I found falling wedge pattern in creation and potential upside movement. Due to potential downside exhaustion and bull crosses

Petar Jacimovic 09:35 2023-03-24 UTC+2
หากไม่สะดวกคุยในตอนนี้
ระบุคำถามไว้ได้ใน แชท.