empty
 
 
27.01.2023 07:05 PM
Technical analysis of GBP/USD for January 27, 2023

This image is no longer relevant

Overview:

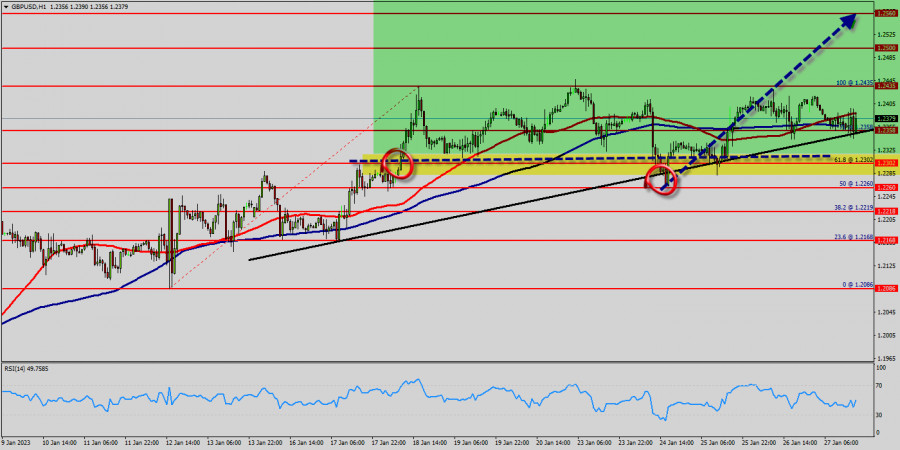
The bullish trend is currently very strong for the GBP/USD pair. As long as the price remains above the weekly support at 1.2260, you could try to take advantage of the bullish rally. The first bullish objective is located at 1.2435. The bullish momentum would be revived by a break in this resistance. Buyers would then use the next resistance located at 1.2500 USD as an objective. Crossing it would then enable buyers to target 1.2500 USD. Be careful, given the powerful bearish rally underway, excesses could lead to a short-term rebound. If this is the case, remember that trading against the trend may be riskier. It would seem more appropriate to wait for a signal indicating reversal of the trend.

Today, the GBP/USD pair has broken resistance at the level of 1.2260 which acts as support now. Thus, the pair has already formed minor support at 1.2260. The strong support is seen at the level of 1.2218 because it represents the weekly support 1. Equally important, the RSI and the moving average (100) are still calling for an uptrend. Therefore, the market indicates a bullish opportunity at the level of 1.2260 on the hourly chart. Also, if the trend is buoyant, then the currency pair strength will be defined as following: GBP is in an uptrend and USD is in a downtrend. Buy above the minor support of 1.2260 with the first target at 1.2358 (this price is coinciding with the ratio of 78% Fibonacci), and continue towards 1.2435 (the weekly resistance 1 - double top - last bullish wave).

On the other hand, if the price closes below the minor support, the best location for the stop loss order is seen below 1.2435; hence, the price will fall into the bearish market in order to go further towards the strong support at 1.2302 to test it again. Furthermore, the level of 1.2260 will form a double bottom.

Bearish outlook : The current rise will remain within a framework of correction. However, if the pair fails to pass through the level of 1.2435, the market will indicate a bearish opportunity below the strong resistance level of 1.2435 (the level of 1.2435 coincides with the double top too). Since there is nothing new in this market, it is not bullish yet. Sell deals are recommended below the level of 1.2435 with the first target at 1.2302. If the trend breaks the support level of 1.2302, the pair is likely to move downwards continuing the development of a bearish trend to the level 1.2219

However, In the very short term, the general bearish sentiment is confirmed by technical indicators. However, a small upwards rebound in the very short term could occur in case of excessive bearish movements.

GBPUSD
Great Britain Pound vs US Dollar
Select timeframe
5
min
15
min
30
min
1
hour
4
hours
1
day
1
week
Start trade
Start trade
  • Grand Choice
    Contest by
    InstaForex
    InstaForex always strives to help you
    fulfill your biggest dreams.
    THAM GIA CUỘC THI
  • Tiền gửi lần truy cập
    Ký quỹ tài khoản của bạn với $3000 và nhận được $8000 nhiều hơn!
    Trong Tháng 3 chúng tôi xổ $8000 trong chiến dịch Chancy Deposit!
    Có được một cơ hội giành chiến thắng bằng việc ký quỹ $3000 vào một tài khoản giao dịch. Đáp ứng được điều kiện này, bạn trở thành một người tham gia chiến dịch.
    THAM GIA CUỘC THI
  • Giao dịch khôn ngoan, thành công
    Nạp tiền vào tài khoản của bạn với ít nhất $ 500, đăng ký cuộc thi và có cơ hội giành được các thiết bị di động.
    THAM GIA CUỘC THI
  • 100% tiền thưởng
    Cơ hội duy nhất của bạn để nhận 100% tiền thưởng khi gửi tiền
    NHẬN THƯỞNG
  • 55% Tiền thưởng
    Đăng ký tiền thưởng 55% cho mỗi lần gửi tiền của bạn
    NHẬN THƯỞNG
  • 30% tiền thưởng
    Nhận 30% tiền thưởng mỗi khi bạn nạp tiền vào tài khoản của mình
    NHẬN THƯỞNG

Recommended Stories

Technical analysis of GBP/USD for March 22, 2023

The GBPUSD pair traded with strong positivity yesterday to return to the bullish channel that appears on the chart, to head towards achieving expected additional gains in the upcoming sessions

Mourad El Keddani 01:32 2023-03-23 UTC+2

Technical analysis of EUR/USD for March 22, 2023

Euro parity still in play ahead of decisive US inflation data, for that common currency came within whisker of 1.0845 this week. Right now, the EUR/USD pair is still moving

Mourad El Keddani 22:19 2023-03-22 UTC+2

GBP/USD: imminent breakout and continuation

The GBP/USD pair continues to challenge the 1.2282 former high which represents an upside obstacle. You knew from my previous analysis that the price could resume its growth as long

Ralph Shedler 19:36 2023-03-22 UTC+2

EUR/USD challenging 1.0788 resistance

The EUR/USD pair extended its growth, registering a new high of 1.0800. Now, it is trading at 1.0791 at the time of writing. The bias is bullish, so further growth

Ralph Shedler 18:02 2023-03-22 UTC+2

Trading Signal for GBP/USD for March 22 - 23, 2023: key level 1.2217 (4/8 Murray - symmetrical triangle)

The key level is located around 1.2217 and around 1.2207. If the British pound breaks both levels and consolidates below the 4/8 Murray, we could expect a strong technical correction

Dimitrios Zappas 15:54 2023-03-22 UTC+2

Technical analysis on Gold for March 22nd, 2023.

Gold price is under pressure. Trend is still bullish as price continues trading inside the blue upward sloping channel. In the near term price is vulnerable to a pull back

Alexandros Yfantis 14:18 2023-03-22 UTC+2

Technical analysis on EURUSD for March 22nd, 2023.

EURUSD is trading around 1.0785. Short-term trend remains bullish a price continues making higher highs and higher lows. Price is inside the upward sloping blue channel and is approaching

Alexandros Yfantis 14:08 2023-03-22 UTC+2

USDJPY breaks out of bearish short-term channel.

USDJPY is trading around 132.82. As we explained in previous posts, USDJPY was very probable to produce a bounce higher as price stopped the decline at the 61.8% retracement level

Alexandros Yfantis 14:05 2023-03-22 UTC+2

March 22, 2023 : EUR/USD daily technical review and trading opportunities.

The market has remained under buying pressure until a plateau level occurred around 1.0800-1.0850. This was followed by a significant SELLING price action leading to the recent price decline

Mohamed Samy 13:20 2023-03-22 UTC+2

March 22, 2023 : EUR/USD Intraday technical analysis and trading plan.

Price action around the key-level of (1.0550-1.0600) was quite bullish. That's why, further bullish continuation towards 1.0800 was demonstrated. Moreover, more bullish advancement towards the nearest supply zone around 1.1150-1.1200

Mohamed Samy 13:18 2023-03-22 UTC+2
Không thể nói chuyện ngay bây giờ?
Đặt câu hỏi của bạn trong phần trò chuyện.