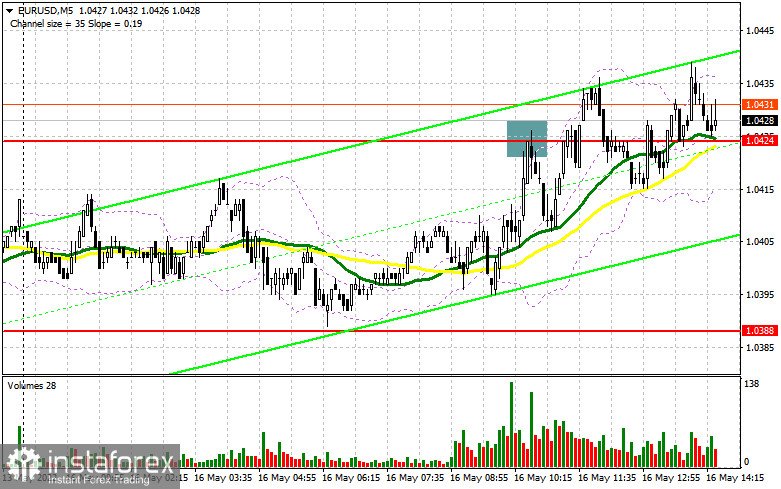
In the morning article, I highlighted the level of 1.0424 and recommended taking decisions with this level in focus. Now let's look at the 5-minute chart and try to figure out what actually happened. The empty economic calendar in the first half of the day and expectations of a more aggressive stance by the ECB helped the euro rise. Yet, its increase was rather modest. An upward movement and a false breakout of 1.0424 according to the morning scenario gave a good entry point into short positions. However, there was no significant downward movement. After the pair fell by about 15 pips, bulls regained momentum. As a result, the pair made another attempt to break through 1.0424, erasing all the gins from shirt positions.
What is needed to open long positions on EUR/USD
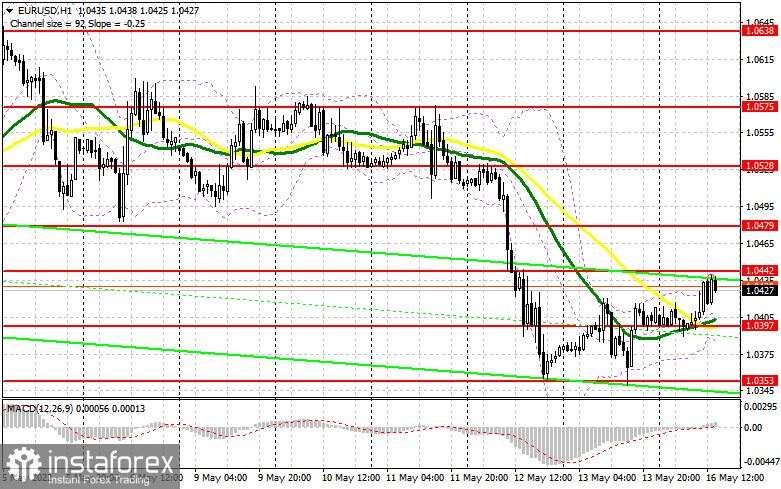
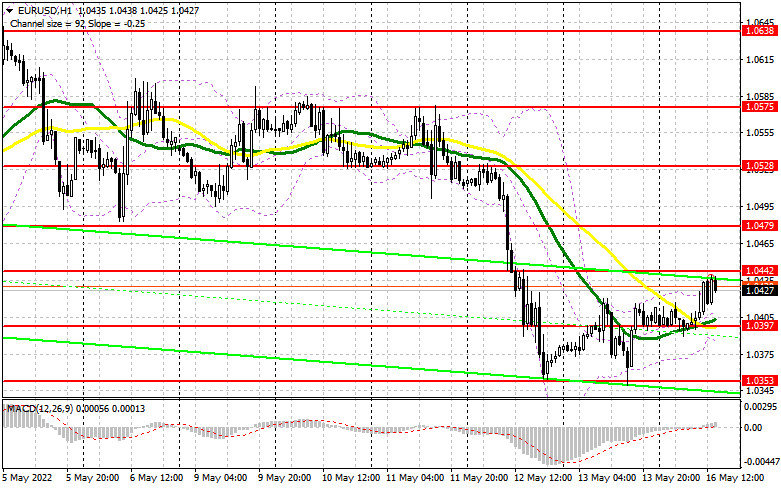
Demand for the euro is recovering slowly but surely amid reports that the ECB may raise the interest rate three times this year to curb inflation. However, there are now main risks to the bullish trend. Economists fear that the EU economy may quickly slide into a recession if there are problems with Russian gas or other commodity supplies. If it happens, inflation is sure to soar to new highs. Such a scenario weighs on risky assets. As for today's intraday fundamental reports, in the second half of the day, there are no important macro statistics that could harm the upward correction. So, I expect the euro to climb to a new resistance level of 1.0442. If after the release of the NY Empire State Manufacturing Index and the speech of FOMC member John Williams the pressure on the euro returns, it is likely to decline to the nearest support of 1.0397. The moving averages are passing in the positive territory near this level. Only a false breakout of this level will give a buy signal, confirming high demand for the euro from retail investors at the beginning of this week. If bulls are in control, a breakout of 1.0442 looks likely. This is the important resistance level that limits the upward movement of the pair. The pair may climb above this level if FOMC policymakers make pessimistic comments. A new buy signal will appear provided that a breakout and a downward test of 1.0442 will take place. It will open the wat to 1.0479 where I recommend locking in profits. A more distant target will be the 1.0528 level. If the pair drops and bears show no activity at 1.0397, which is more likely, the optimal scenario for opening long positions will be a false breakout near this yearly low of 1.0353. It is recommended to buy the euro at this level only after a false breakout. It is possible to open long positions on the euro immediately for a rebound only from 1.0306 or even lower low around 1.0255, keeping in mind an upward intraday correction of 30-35 pips.
What is needed to open short positions on EUR/USD
Sellers have tried to take the upper hand but they are weak at the beginning of the week. The primary task for the second half of the day is to protect the new resistance level of 1.0442, as well as to return to control over the physiologically important support level of 1.0397. Only a breakout and an upward test of 1.0397, as well as positive US economic reports, will give an additional sell signal. If so, the pair may decrease to swing lows around 1.0353 and 1.0306 where I recommend locking in profits. If Fed members hint at more aggressive measures, the price may slip to 1.0255 in the near future. In EUR/USD rises, it is recommended to open short positions after a false breakout of the resistance level of 1.0442, similar to the scenario I discussed above. If bears show no energy at this level, a sharper upward reversal may occur at the beginning of this week. If so, it is better to open short positions after a false breakout of 1.0479. You can sell EUR/USD immediately on a rebound from 1.0528, keeping in mind a downward intraday correction of 25-30 pips.
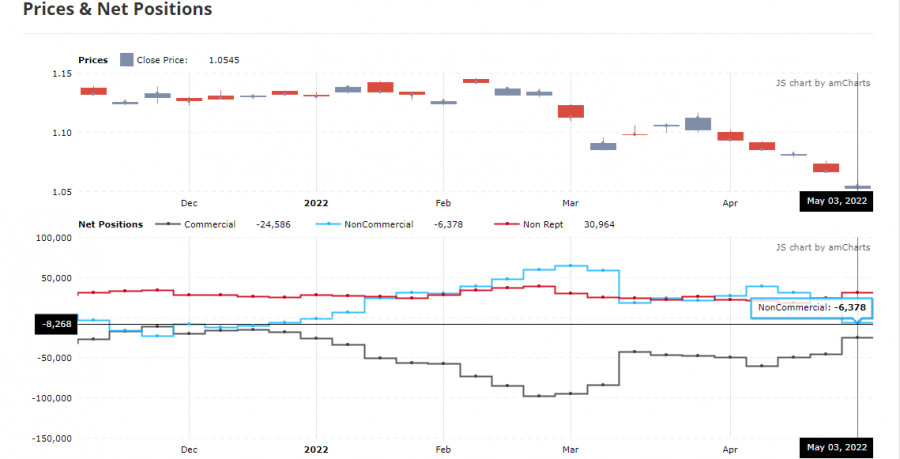
COT report
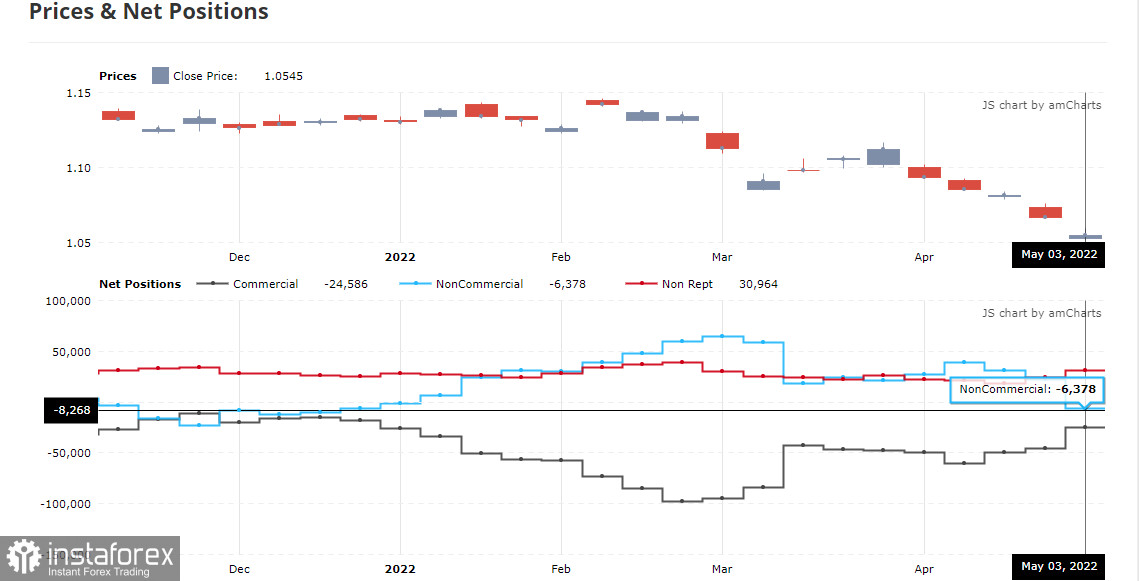
The COT report (Commitment of Traders) for May 3 logged a sharp increase in short positions and a decline in long ones. The recent announcements made by central banks caused a sell-off of risky assets. Market participants are now sure that developed economies should be bracing for serious economic problems this year. A sharp increase in the US key interest rate by 0.5% spurred demand for the US dollar as a safe-haven asset. The Fed is not the only central bank that is dealing with soaring inflation. Many states worldwide are now facing the same problem. Rapid tightening of the Fed's monetary policy is making the greenback attractive for investors. In her speeches, ECB President Christine Lagarde stressed the need for significant changes in monetary policy parameters. The regulator is expected to end the bond purchase program by the end of the second quarter of this year. The first rate increase is likely to occur in the fall of this year. While the ECB is making plans, the FCB is taking decisive actions. It is quite bullish for the US dollar. Its trajectory will depend on inflation and market reaction. If inflation falls a bit, pressure on the euro may become weaker. It may facilitate the growth of risk assets, allowing the euro to start an upward correction. The COT report revealed that the number of long positions dropped to 208,449 from 221,003, while the number of short positions soared to 214,827 from 189,702. Notably, the euro's low price is making it attractive for traders. That is why the asset remains in demand despite the dominance of the bearish sentiment. According to the week's results, total non-commercial net position decreased to -6,378. The weekly close price slumped to 1.0545 from 1.0667.
Signals of technical indicators
Moving averages
EUR/USD is trading above 30- and 50-period moving averages. It means that the bulls don't give up attempts to carry on with an upward correction.
Remark. The author is analyzing the period and prices of moving averages on the 1-hour chart. So, it differs from the common definition of classic daily moving averages on the daily chart.
Bollinger Bands
In case of a rise, the upper border around 1.0440 will act as resistance.
Definitions of technical indicators
- Moving average recognizes an ongoing trend through leveling out volatility and market noise. A 50-period moving average is plotted yellow on the chart.
- Moving average identifies an ongoing trend through leveling out volatility and market noise. A 30-period moving average is displayed as the green line.
- MACD indicator represents a relationship between two moving averages that is a ratio of Moving Average Convergence/Divergence. The MACD is calculated by subtracting the 26-period Exponential Moving Average (EMA) from the 12-period EMA. A 9-day EMA of the MACD called the "signal line".
- Bollinger Bands is a momentum indicator. The upper and lower bands are typically 2 standard deviations +/- from a 20-day simple moving average.
- Non-commercial traders - speculators such as retail traders, hedge funds, and large institutions who use the futures market for speculative purposes and meet certain requirements.
- Non-commercial long positions represent the total long open position of non-commercial traders.
- Non-commercial short positions represent the total short open position of non-commercial traders.
- The overall non-commercial net position balance is the difference between short and long positions of non-commercial traders.