empty
 
 
28.11.2022 04:35 PM
EUR/USD analysis for November 28. Unexpected growth in the euro marked the beginning of the week.

This image is no longer relevant

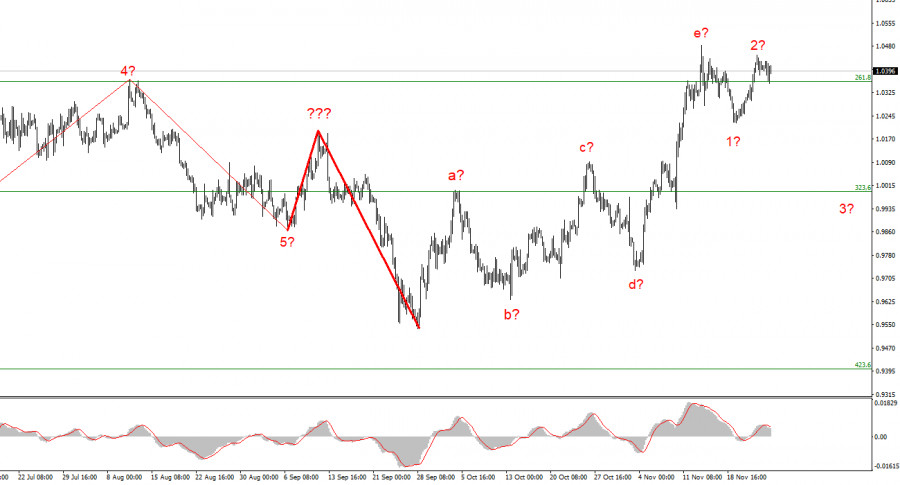
Although it still looks compelling, the wave marking on the 4-hour chart for the euro/dollar instrument needs to be adjusted. The upward portion of the trend has corrected itself. We have discovered a sophisticated a-b-c-d-e wave correction structure. Since the peak of wave e exceeds the peak of wave C, if the current wave layout is accurate, construction on this structure may be nearly finished or already be finished. In this instance, it is anticipated that we will construct at least three waves downward, but if the most recent phase of the trend is corrective, the subsequent phase would probably be impulsive. Therefore, I am preparing for a new significant decline in the instrument. The market will be ready to sell when a new attempt to break the 1.0359 mark, which corresponds to 261.8% Fibonacci, is successful. The entire wave e, however, turns out to be longer, and the most recent decline of the instrument is the first wave of a new descending section because quotes have moved away from the lows they reached last week and on Monday. However, the alleged waves two or b might still exist because they only punctured the wave e's peak. Because there isn't an increase in demand for US currency, the wave pattern is generally starting to become muddled.

Although there is no current news, interest in the euro is again rising.

The euro/dollar instrument increased by 75 basis points to begin the new week. The increase from the day's low was 150 points, but the instrument fell at night. The fact that the market is trading so actively on the first day of the week surprises me more than the increasing demand for the euro. At the time the article was written, there was no relevant news, but ECB President Christine Lagarde will give a speech today. It is unlikely that Lagarde's future performance was why the market was trading so briskly.

Most of the most recent news came from China, where the "coronavirus" is becoming more prevalent. Since the nation has already implemented strict regulations to halt the rapid spread of COVID, this unnerves investors and market participants. These limitations portend new business, economic, and industrial activity declines, which will negatively impact other economic indicators. As a result, there is now a new threat to China's economy, which depends on many other nations' economies. In these circumstances, it would be much more logical if the market saw a rise in demand for the dollar as a safe currency. But it's also important to keep in mind that during the first year of the pandemic, there was a decline in the demand for dollars, so this is what we can see now. Of course, the pandemic does not present the same threat it did in 2019–2020. Humanity is now largely prepared for it. However, if it weren't for this aspect, I'd still think that work should start in the downward trend section. Now, I'm not so sure about this.

This image is no longer relevant

Conclusions in general

I conclude that the upward trend section's construction is complete and has increased complexity to five waves. As a result, I suggest making sales with targets close to the estimated 0.9994 level, or 323.6% Fibonacci. There is a chance that the upward section of the trend will become more complicated and take on an extended form, but this chance is currently at most 10%.

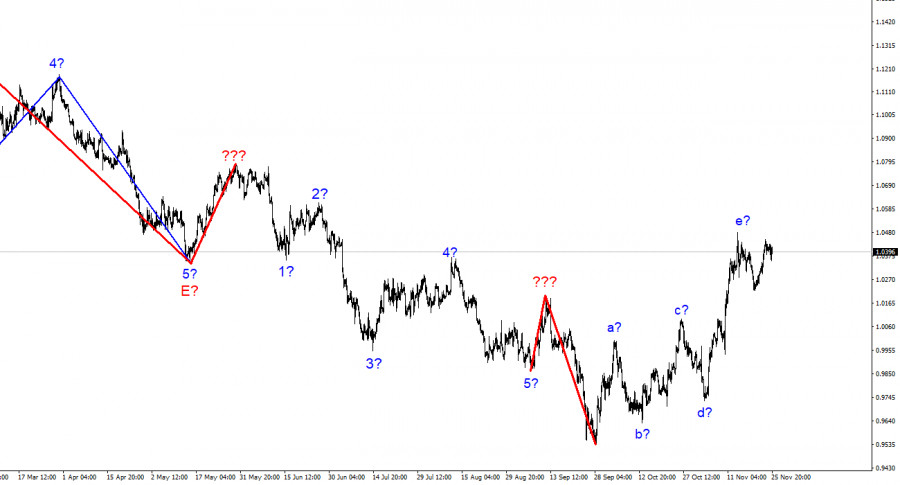
The wave marking of the descending trend segment becomes more intricate and lengthens at the higher wave scale. The a-b-c-d-e structure is most likely represented by the five upward waves we observed. After the construction of this section is finished, work on a downward trend section may resume.

Chin Zhao,
ผู้เชี่ยวชาญด้านการวิเคราะห์ของ InstaForex
© 2007-2023
EURUSD
Euro vs US Dollar
Select timeframe
5
min
15
min
30
min
1
hour
4
hours
1
day
1
week
Start trade
Start trade
  • Grand Choice
    Contest by
    InstaForex
    InstaForex always strives to help you
    fulfill your biggest dreams.
    เข้าร่วมการแข่งขัน
  • Chancy Deposit
    ฝากเงินในบัญชีของคุณใน $3,000 และรับ $1000 ไปเพิ่ม!
    ใน เมษายน ทางเราได้ออก$1000 ภายในแคมเปญ Chancy Deposit !
    คว้าโอกาสที่จะชนะด้วยการฝากเงิน $3,000 ไปในบัญชีเทรด เมื่อทำตามเงื่อนไขนี้แล้ว คุณก็จะกลายเป็นผู้เข้าร่วมแคมเปญ
    เข้าร่วมการแข่งขัน
  • เทรดให้ดีแล้วคว้ารางวัล
    เติมเงินในบัญชีของคุณอย่างน้อย $500 สมัครเข้าร่วมการแข่งขัน และลุ้นรับรางวัลอุปกรณ์ติดต่อสื่อสารแบบพกพา
    เข้าร่วมการแข่งขัน
  • โบนัส 100%
    โอกาสพิเศษของคุณในการรับโบนัส 100% จากเงินฝากของคุณ
    รับโบนัส
  • โบนัส 55%
    สมัครรับโบนัส 55% สำหรับการฝากทุกครั้ง
    รับโบนัส
  • โบนัส 30%
    รับโบนัส 30% ทุกครั้งที่คุณเติมเงินในบัญชีของคุณ
    รับโบนัส

Recommended Stories

EUR/USD. Analysis for March 31, 2023

The last upward wave has caused more confusion with the wave analysis on the 4-hour chart for the euro/dollar pair. Given that the previous descending segment can be viewed

Chin Zhao 18:33 2023-03-31 UTC+2

Elliott wave analysis of UNG for March 31, 2023

Our proxy for Natural Gas, UNG, is in the very final stages for the decline from 34.50. We think that a final spike to just below 6.58 could be seen

Torben Melsted 06:13 2023-03-31 UTC+2

Elliott wave analysis of EUR/USD for March 31, 2023

EUR/USD is challenging resistance at 1.0930. A break above here will open the door for a higher move towards resistance at 1.1033 on the way higher to the first upside

Torben Melsted 06:09 2023-03-31 UTC+2

GBP/USD. Analysis for March 30, 2023

The wave analysis for the pound/dollar pair now appears challenging, but it does not call for any clarifications. There are some differences between the wave patterns of the euro

Chin Zhao 16:44 2023-03-30 UTC+2

EUR/USD. Analysis for March 30. The euro continues to build an upward set of waves

The last upward wave has caused more confusion with the wave analysis on the 4-hour chart for the euro/dollar pair. Given that the previous descending segment can be viewed

Chin Zhao 16:12 2023-03-30 UTC+2

Elliott wave analysis of EUR/JPY for March 30, 2023

The long-term picture of EUR/JPY shows that a multi-year triangle completed with the test of 114.20 in May 2020 and a new impulsive rally was initiated. This rally has much

Torben Melsted 07:45 2023-03-30 UTC+2

Elliott wave analysis of USD/JPY for March 30, 2023

Today we will take a view of the long-term picture of USD/JPY. After the peak in October 2022 at 151.94, we have seen wave A move lower to test support

Torben Melsted 07:37 2023-03-30 UTC+2

GBP/USD. Analysis for March 29. The pound continues to form an unclear wave

The wave analysis for the pound/dollar pair now appears challenging, but it does not call for any clarifications. There are some distinctions between the wave patterns of the euro

Chin Zhao 17:51 2023-03-29 UTC+2

EUR/USD. Analysis for March 29. The market is waiting for a new acceleration of core inflation in the European Union.

The final upward wave continues to confuse the wave pattern on the 4-hour chart for the euro/dollar pair. Since the previous downward trend segment can be viewed as a three-wave

Chin Zhao 17:31 2023-03-29 UTC+2

Elliott wave analysis of EUR/USD for March 29, 2023

EUR/USD has rallied nicely of the 50% corrective target at 1.0723 and is currently testing short-term important resistance at 1.0840. A clear break above here will confirm that the correction

Torben Melsted 07:39 2023-03-29 UTC+2
หากไม่สะดวกคุยในตอนนี้
ระบุคำถามไว้ได้ใน แชท.