empty
 
 
05.12.2022 11:01 AM
EUR/USD and GBP/USD technical analysis on December 5, 2022

EUR/USD

This image is no longer relevant

Higher time frames

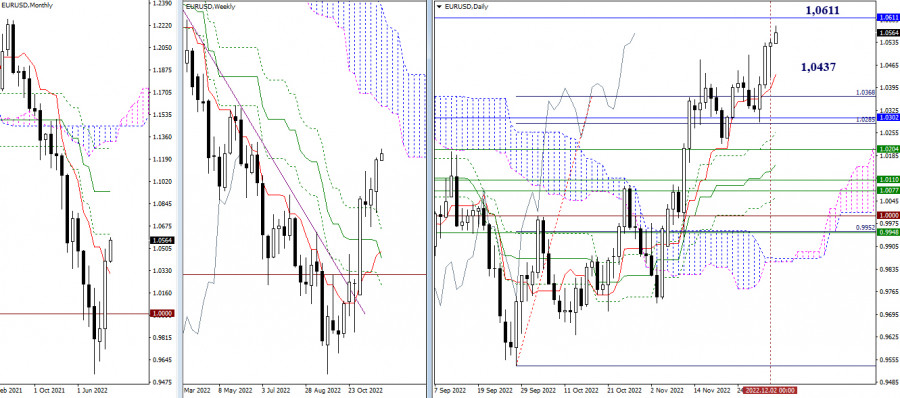
Bulls closed last trading week on a positive note. Today, they have already managed to retest the high, while rising to the monthly resistance level of 1.0611. The behavior of the price after testing this level will determine the future trajectory of the pair. In case of its breakout, the pair will head for the weekly Ichimoku Cloud and the medium-term trend. If the pair rebounds from it, the scope of decline will show the strength of the bears. The daily and monthly short-term trends at 1.0437 and 1.0302 will act as support. Otherwise, support can be found at the levels of the weekly Ichimoku Cross.

This image is no longer relevant

H4 – H1

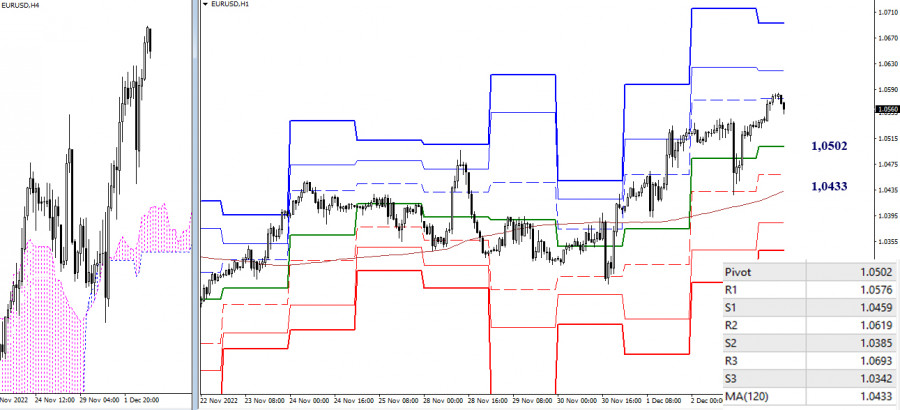
Bulls are currently prevailing on lower time frames. At the moment, they are testing the first resistance of the standard pivot levels at 1.0576. The next upward targets are seen at 1.0619 (R2) and 1.0693(R3). If bears regain ground when the pair slows down and retests these levels, the key targets will be found at the support levels on lower time frames: 1.0502 (central pivot level of the day) and 1.0433 (weekly long-term trend).

***

GBP/USD

This image is no longer relevant

Higher time frames

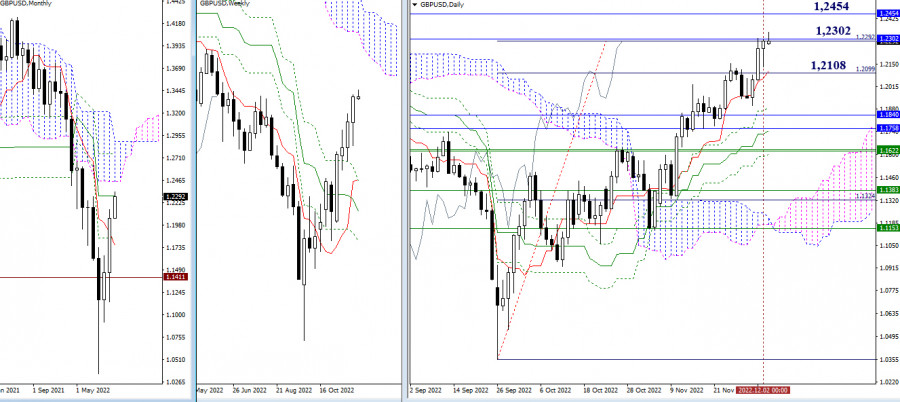
Last week, bulls began testing important upward targets located in the area of 1.2292 - 1.2302 (fully tested target + monthly medium-term trend). A breakout of this range may allow the pair to rise to the resistance of the monthly Ichimoku Cloud at 1.2454. Meanwhile, a pullback could bring the pair back to the daily short-term trend at 1.2108 or provoke a change in the market sentiment. If so, bears may reach better results in the long term.

This image is no longer relevant

H4 – H1

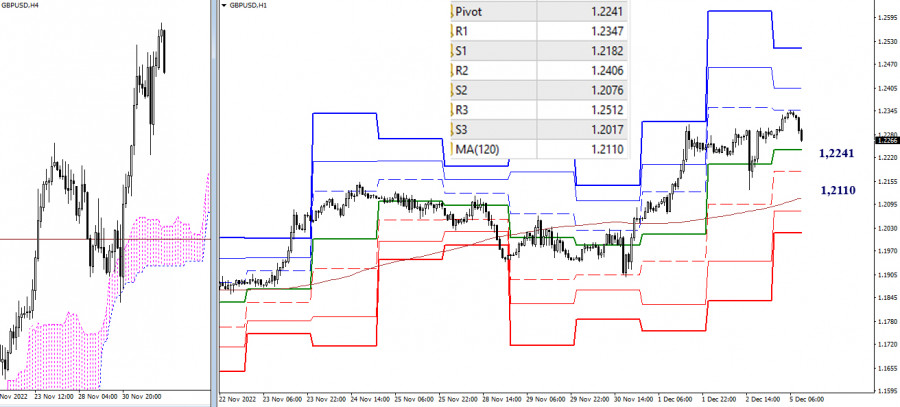
Today, intraday targets for the bulls are located at 1.2347 - 1.2406 - 1.2512 (resistance of the standard pivot levels). The key support levels on lower time frames are found at 1.2241 (standard pivot level) and 1.2110 (weekly long-term trend). The interim support is seen at 1.2182 (S1). Consolidation below this support area and a reversal of the moving average will change the market balance. Until then, buyers are still in control of the market on lower time frames.

***

Technical analysis is based on:

Higher time frames – Ichimoku Kinko Hyo (9.26.52) + Fibo Kijun levels

H1 – Pivot Points (standard) + 120-day Moving Average (weekly long-term trend)

EURUSD
Euro vs US Dollar
Select timeframe
5
min
15
min
30
min
1
hour
4
hours
1
day
1
week
Start trade
Start trade
  • Grand Choice
    Contest by
    InstaForex
    InstaForex always strives to help you
    fulfill your biggest dreams.
    เข้าร่วมการแข่งขัน
  • Chancy Deposit
    ฝากเงินในบัญชีของคุณใน $3,000 และรับ $8000 ไปเพิ่ม!
    ใน มีนาคม ทางเราได้ออก$8000 ภายในแคมเปญ Chancy Deposit !
    คว้าโอกาสที่จะชนะด้วยการฝากเงิน $3,000 ไปในบัญชีเทรด เมื่อทำตามเงื่อนไขนี้แล้ว คุณก็จะกลายเป็นผู้เข้าร่วมแคมเปญ
    เข้าร่วมการแข่งขัน
  • เทรดให้ดีแล้วคว้ารางวัล
    เติมเงินในบัญชีของคุณอย่างน้อย $500 สมัครเข้าร่วมการแข่งขัน และลุ้นรับรางวัลอุปกรณ์ติดต่อสื่อสารแบบพกพา
    เข้าร่วมการแข่งขัน
  • โบนัส 100%
    โอกาสพิเศษของคุณในการรับโบนัส 100% จากเงินฝากของคุณ
    รับโบนัส
  • โบนัส 55%
    สมัครรับโบนัส 55% สำหรับการฝากทุกครั้ง
    รับโบนัส
  • โบนัส 30%
    รับโบนัส 30% ทุกครั้งที่คุณเติมเงินในบัญชีของคุณ
    รับโบนัส

Recommended Stories

March 31, 2023 : EUR/USD daily technical review and trading opportunities.

The price level of 1.0930 remained a significant resistance level to offer SELL opportunities until the recent upside movement temporarily extended up to 1.1000. That's why, the next target

Mohamed Samy 20:03 2023-03-31 UTC+2

March 31, 2023 : EUR/USD Intraday technical analysis and trading plan.

Price action around the key-level of (1.0550-1.0600) was quite bullish. That's why, further bullish continuation towards 1.0800 was demonstrated. Moreover, more bullish advancement towards the nearest supply zone around 1.1150-1.1200

Mohamed Samy 20:02 2023-03-31 UTC+2

March 31, 2023 : GBP/USD Intraday technical analysis and significant key-levels.

The GBPUSD bulls failed to record a new high. Instead, a descending high was established around the same price level. Bearish pullback pursued towards the price levels of 1.1800. This

Mohamed Samy 20:01 2023-03-31 UTC+2

NZD/USD standing below strong upside obstacle

The NZD/USD pair is located at 0.6263 at the time of writing. As you can see on the H1 chart, it stands below 0.6273 - 0.6291 supply zone (upside obstacle)

Ralph Shedler 18:58 2023-03-31 UTC+2

Trading Signal for GOLD (XAU/USD) for March 31, 2023: sell below $1,979 (21 SMA - symmetrical triangle)

In the chart above, we can observe a symmetrical triangle formation. The break below 1,960 could confirm a bearish movement in the short. In the medium term, the price could

Dimitrios Zappas 16:24 2023-03-31 UTC+2

USD/CAD: upside reversal needs confirmation

The USD/CAD pair crashed in the last hours and it seems determined to reach and retest the near-term support levels before developing a new bullish momentum. After its massive drop

Ralph Shedler 15:59 2023-03-31 UTC+2

Monthly USDJPY analysis and the Inverted head and shoulders pattern

In previous posts we have talked about the major bullish pattern of the inverted head and shoulders pattern in USDJPY. We have posted the monthly chart several times even before

Alexandros Yfantis 13:56 2023-03-31 UTC+2

Technical analysis on EURUSD for March 31st, 2023.

EURUSD is trading around 1.0886. Price is under pressure today. Price has so far respected the key support neckline and cancelled the bearish Head and Shoulders pattern. At the same

Alexandros Yfantis 12:01 2023-03-31 UTC+2

Technical analysis on NZDUSD for March 31st, 2023.

NZDUSD is trading around 0.6260. Price recently tested the black neckline resistance for the 4th time and it seems it is getting rejected once again. In the near term price

Alexandros Yfantis 11:55 2023-03-31 UTC+2

Technical analysis on Gold for March 31st, 2023.

Gold price is trading around $1,979. Price remains inside the triangle pattern we mentioned in our previous analysis. Price has reached the short-term resistance level of $1,983 where we find

Alexandros Yfantis 11:52 2023-03-31 UTC+2
หากไม่สะดวกคุยในตอนนี้
ระบุคำถามไว้ได้ใน แชท.