empty
 
 
05.12.2022 11:01 AM
EUR/USD and GBP/USD technical analysis on December 5, 2022

EUR/USD

This image is no longer relevant

Higher time frames

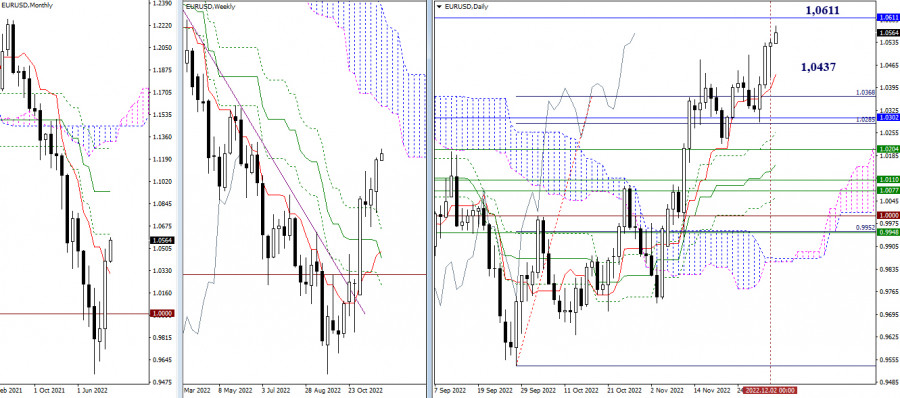
Bulls closed last trading week on a positive note. Today, they have already managed to retest the high, while rising to the monthly resistance level of 1.0611. The behavior of the price after testing this level will determine the future trajectory of the pair. In case of its breakout, the pair will head for the weekly Ichimoku Cloud and the medium-term trend. If the pair rebounds from it, the scope of decline will show the strength of the bears. The daily and monthly short-term trends at 1.0437 and 1.0302 will act as support. Otherwise, support can be found at the levels of the weekly Ichimoku Cross.

This image is no longer relevant

H4 – H1

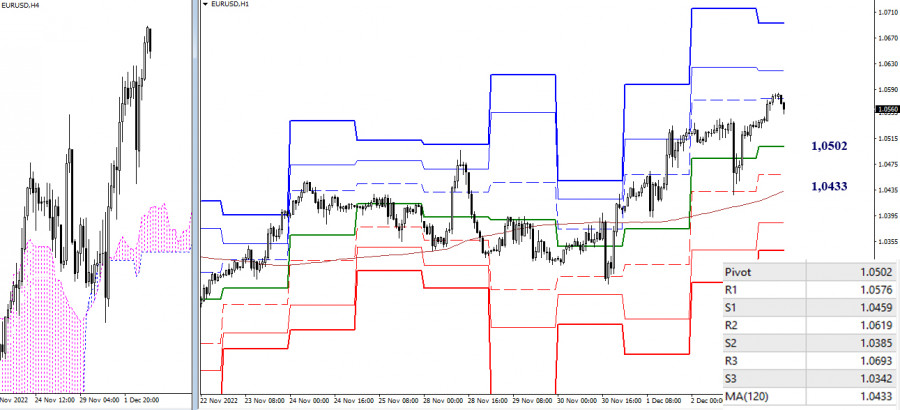
Bulls are currently prevailing on lower time frames. At the moment, they are testing the first resistance of the standard pivot levels at 1.0576. The next upward targets are seen at 1.0619 (R2) and 1.0693(R3). If bears regain ground when the pair slows down and retests these levels, the key targets will be found at the support levels on lower time frames: 1.0502 (central pivot level of the day) and 1.0433 (weekly long-term trend).

***

GBP/USD

This image is no longer relevant

Higher time frames

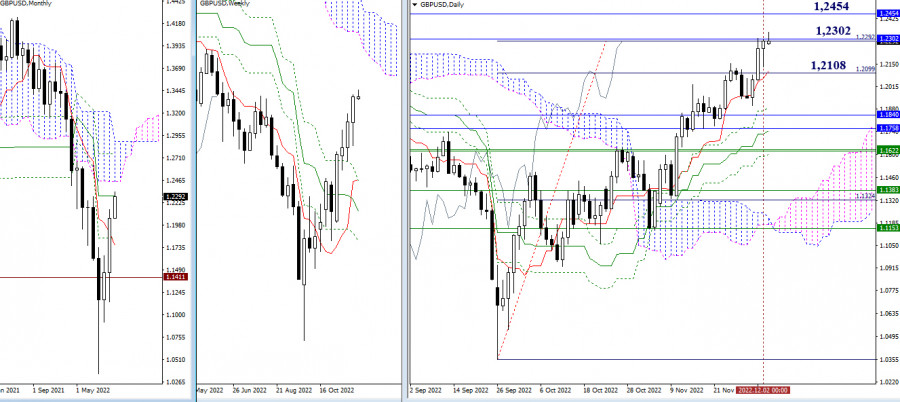
Last week, bulls began testing important upward targets located in the area of 1.2292 - 1.2302 (fully tested target + monthly medium-term trend). A breakout of this range may allow the pair to rise to the resistance of the monthly Ichimoku Cloud at 1.2454. Meanwhile, a pullback could bring the pair back to the daily short-term trend at 1.2108 or provoke a change in the market sentiment. If so, bears may reach better results in the long term.

This image is no longer relevant

H4 – H1

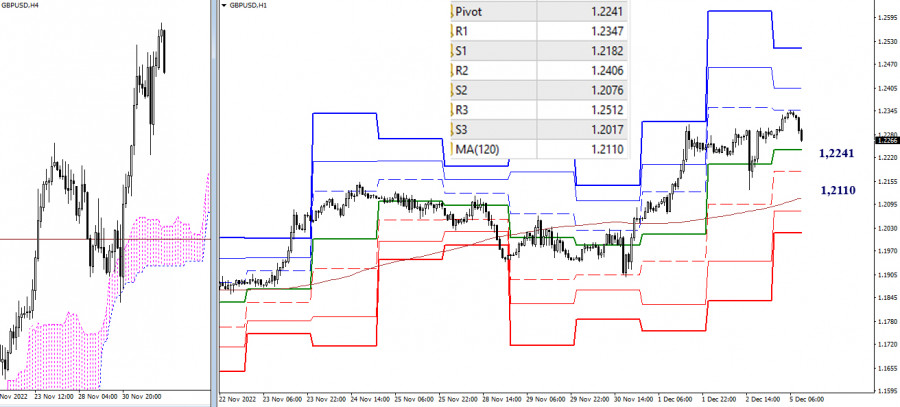
Today, intraday targets for the bulls are located at 1.2347 - 1.2406 - 1.2512 (resistance of the standard pivot levels). The key support levels on lower time frames are found at 1.2241 (standard pivot level) and 1.2110 (weekly long-term trend). The interim support is seen at 1.2182 (S1). Consolidation below this support area and a reversal of the moving average will change the market balance. Until then, buyers are still in control of the market on lower time frames.

***

Technical analysis is based on:

Higher time frames – Ichimoku Kinko Hyo (9.26.52) + Fibo Kijun levels

H1 – Pivot Points (standard) + 120-day Moving Average (weekly long-term trend)

Evangelos Poulakis,
انسٹافاریکس کا تجزیاتی ماہر
© 2007-2023
EURUSD
Euro vs US Dollar
ٹائم فریم منتخب کریں
5
منٹ
15
منٹ
30
منٹ
1
گھنٹہ
4
گھنٹے
1
دن
1
ہفتہ
تجارت شروع کریں
تجارت شروع کریں
  • Grand Choice
    Contest by
    InstaForex
    InstaForex always strives to help you
    fulfill your biggest dreams.
    مقابلہ میں شامل ہوں
  • چانسی ڈیپازٹ
    اپنے اکاؤنٹ میں 3000 ڈالر جمع کروائیں اور حاصل کریں$8000 مزید!
    ہم مارچ قرعہ اندازی کرتے ہیں $8000چانسی ڈیپازٹ نامی مقابلہ کے تحت
    اپنے اکاؤنٹ میں 3000 ڈالر جمع کروانے پر موقع حاصل کریں - اس شرط پر پورا اُترتے ہوئے اس مقابلہ میں شرکت کریں
    مقابلہ میں شامل ہوں
  • ٹریڈ وائز، ون ڈیوائس
    کم از کم 500 ڈالر کے ساتھ اپنے اکاؤنٹ کو ٹاپ اپ کریں، مقابلے کے لیے سائن اپ کریں، اور موبائل ڈیوائسز جیتنے کا موقع حاصل کریں۔
    مقابلہ میں شامل ہوں
  • 100 فیصد بونس
    اپنے ڈپازٹ پر 100 فیصد بونس حاصل کرنے کا آپ کا منفرد موقع
    بونس حاصل کریں
  • 55 فیصد بونس
    اپنے ہر ڈپازٹ پر 55 فیصد بونس کے لیے درخواست دیں
    بونس حاصل کریں
  • 30 فیصد بونس
    ہر بار جب آپ اپنا اکاؤنٹ ٹاپ اپ کریں تو 30 فیصد بونس حاصل کریں
    بونس حاصل کریں

Recommended Stories

برطانوی پاؤنڈ/امریکی ڈالر کا تکنیکی تجزیہ برائے 24 مارچ 2023

تکنیکی مارکیٹ آؤٹ لک: برطانوی پاؤنڈ/امریکی ڈالر کی جوڑی نے 1.2342 کی سطح پر ایک نیا سوئنگ بنایا ہے اور 1.2260 کی سطح کی طرف پُل بیک ہوا ہے۔ رفتار

Sebastian Seliga 16:46 2023-03-24 UTC+2

یورو/امریکی ڈالر کا تکنیکی تجزیہ برائے 24 مارچ 2023

تکنیکی مارکیٹ آؤٹ لک: یورو/امریکی ڈالر کی جوڑی نے 1.0930 کی سطح پر ایک نئی بلند سطح بنائی ہے اور 4 گھنٹے کے ٹائم فریم چارٹ پر مارکیٹ کی انتہائی

Sebastian Seliga 16:46 2023-03-24 UTC+2

برطانوی پاؤنڈ/امریکی ڈالر کا تکنیکی تجزیہ برائے 23 مارچ 2023

تکنیکی مارکیٹ آؤٹ لک: برطانوی پاؤںڈ/امریکی ڈالر کی جوڑی نے 1.2335 کی سطح پر ایک نئی بلند سطح بنائی ہے، اس لیے آج بینک آف انگلینڈ

Sebastian Seliga 12:41 2023-03-23 UTC+2

یورو/امریکی ڈالر کا تکنیکی تجزیہ برائے 23 مارچ 2023

مارکیٹ کا تکنیکی آؤٹ لک: ایف ای ڈی کی جانب سے توقع کے مطابق شرح سود میں اضافے کے بعد یورو/امریکی ڈالر کی جوڑی نے 1.0930

Sebastian Seliga 12:40 2023-03-23 UTC+2

یورو / یو ایس ڈی کا تکنیکی تجزیہ برائے 22 مارچ 2023

یورو / یو ایس ڈی 1.0785 کے آس پاس ٹریڈ کر رہا ہے۔ قلیل مدتی رجحان میں تیزی برقرار ہے ایک قیمت مسلسل ہائیر ہائی اور ہائیر

Alexandros Yfantis 14:54 2023-03-22 UTC+2

سونے کا تکنیکی تجزیہ برائے 22 مارچ 2023

سونے کی قیمت دباؤ میں ہے۔ رجحان اب بھی بُلش ہے کیونکہ قیمت نیلے اضافہ کے ڈھلوانی چینل کے اندر تجارت جاری رکھے ہوئے ہے۔ قریبی مدت میں قیمت

Alexandros Yfantis 14:18 2023-03-22 UTC+2

یو ایس ڈی / جے پی وائے نے قلیل مُدتی بئیرش چینل کو توڑ دیا ہے

یو ایس ڈی / جے پی وائے 132.82 کے آس پاس تجارت کر رہا ہے۔ جیسا کہ ہم نے سابقہ تجزیات میں وضاحت کی تھی،

Alexandros Yfantis 14:15 2023-03-22 UTC+2

برطانوی پاؤنڈ/امریکی ڈالر کا تکنیکی تجزیہ برائے 22 مارچ 2023

تکنیکی مارکیٹ آؤٹ لک: برطانوی پاؤنڈ/امریکی ڈالر کی جوڑی نے 1.2283 کی سطح پر ایک نیا سوئنگ لیا ہے اور پھر بئیرز نے پل بیک شروع کر دیا ہے۔

Sebastian Seliga 11:20 2023-03-22 UTC+2

یورو/امریکی ڈالر کا تکنیکی تجزیہ برائے مارچ 22 ,2023

تکنیکی مارکیٹ آؤٹ لک: یورو/امریکی ڈالر کی جوڑی نے 1.0789 کی سطح پر ایک نیا سوئنگ بنایا ہے اور فی الحال 1.0760 - 1.0789 کی سطح کے درمیان واقع

Sebastian Seliga 11:19 2023-03-22 UTC+2

یو ایس ڈی جے پی وائے کا تکنیکی تجزیہ برائے 21 مارچ 2023

کل ہمارے یو ایس ڈی جے پی وائے تجزیہ میں ہم نے نوٹ کیا کہ اضافہ کے امکانات بڑھ گئے ہیں۔ قیمت 130.56 پر کم ہوگئی اور اب اوپری چینل

Alexandros Yfantis 20:37 2023-03-21 UTC+2
ابھی فوری بات نہیں کرسکتے ؟
اپنا سوال پوچھیں بذریعہ چیٹ.