4-hour timeframe
Amplitude of the last 5 days (high-low): 55p - 64p - 75p - 56p - 41p.
Average volatility over the past 5 days: 58p (average).
The second trading day of the week for the EUR/USD pair is held in absolutely calm trading with low volatility. As we said in yesterday's evening review, the pair will be prone to a downward correction at least before the ECB meeting and the Mario Draghi press conference on Thursday. Thus, tomorrow is another day of news lull. No interesting information was received from the European Union and the United States either yesterday or today. Amid such a lull, traders have no choice but to pay attention to the ongoing ups and downs associated with Brexit. But even they do not influence the preferences of traders and their activity too much. Thus, at least one more trading day, market participants will be in a state of fundamental hunger.
We will try to figure out today what can await us at the ECB meeting, as well as the prospects for the euro for the next six months or a year. From our point of view, everything will depend not on the actions of the ECB, but on the actions of the Federal Reserve. As we have repeatedly said, the ECB has almost exhausted all its strongest trump cards in the confrontation with the recession into which the EU's economy is slipping. That is, the rates are already negative, and it was during these negative rates that the EU economy began to slow down again. As a result, the deposit rate was again lowered, and what next, if the drop in macroeconomic indicators is not stopped? The quantitative easing program will not be effective until November 1. It is unlikely that the regulator will immediately expand it. Most likely, it will only take several months to assess its impact on the economy of the European Union. And only then, if there are no positive effects or if the external economic situation worsens, it will be possible to count on a new easing of monetary policy or on additional stimulation. Thus, in the next six months or a year, it is hardly worth expecting more than one rate cut. At the moment, the probability of such an outcome is no more than 45%, according to the estimates of world analytical agencies.
But the Fed has much to reduce the rate. At the moment, it is equal to 2.0%, which makes it possible for at least another 8 declines. After all, Donald Trump spoke of a rate of 0.0% as necessary for the economy. In addition, the Fed may also revive the QE program. Thus, the Fed has a lot of room for maneuver in stimulating the economy, if necessary, and also in meeting the demands of the US president. And if the Fed uses these tools, involuntarily or voluntarily, these will be factors that will already work in favor of the euro. This is precisely the chance of the euro to complete the long-term downward trend.
The ECB meeting on Thursday, according to many experts, will be a farewell ceremony for Mario Draghi, who will be replaced by Christine Lagarde as head of the Regulator on November 1. Traders also do not believe that the ECB will make any changes in monetary policy, therefore, the key event will be the press conference of Draghi, in which he is likely to answer questions related to QE and assessing the current state of the EU economy.
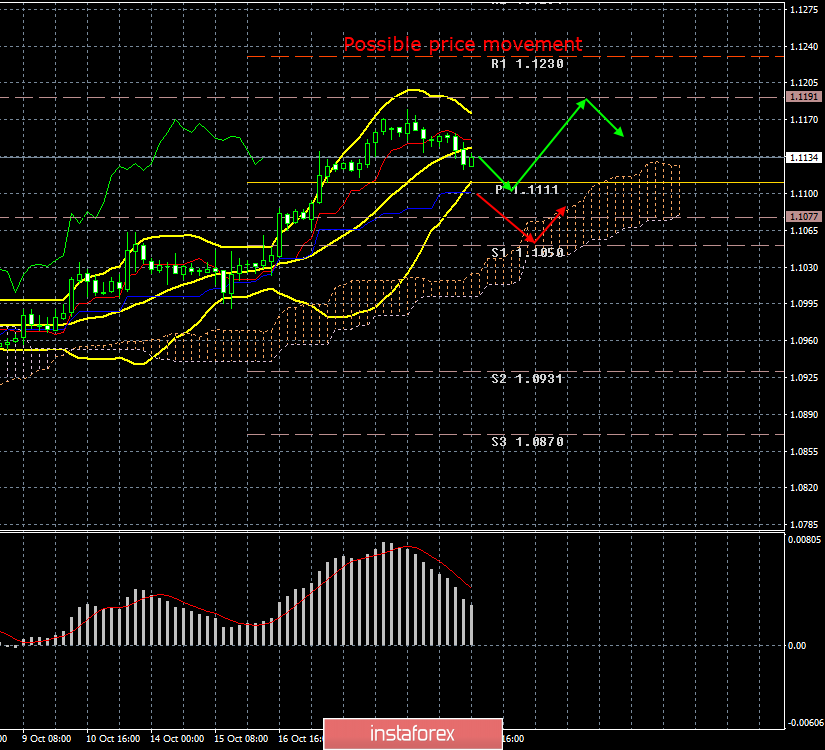
The technical picture of the pair is almost unambiguous - a downward correction to the Kijun-sen critical line, then we will expect a rebound from this line in accordance with the continuing upward trend.
Trading recommendations:
The EUR/USD pair continues to adjust. Thus, it is recommended that traders wait for the completion of the current correction and only after that resume trading on the increase with targets of 1.1191 and 1.1230. It is recommended to return to selling the euro currency not earlier than when the bears overcome the critical Kijun-sen line, which will be the first signal of a change in trend.
In addition to the technical picture, fundamental data and the time of their release should also be taken into account.
Explanation of the illustration:
Ichimoku indicator:
Tenkan-sen is the red line.
Kijun-sen is the blue line.
Senkou Span A - light brown dotted line.
Senkou Span B - light purple dashed line.
Chikou Span - green line.
Bollinger Bands Indicator:
3 yellow lines.
MACD indicator:
Red line and bar graph with white bars in the indicator window.