Good day!
In today's review, we will analyze the technical picture of one of the most interesting and favorite currency pairs for traders. As noted earlier, the Japanese yen was the only major currency that ended trading on April 6-10 with losses against the US dollar. Nevertheless, this factor has its own characteristic feature, and in order to make sure of this, let's turn our eyes to the weekly timeframe.
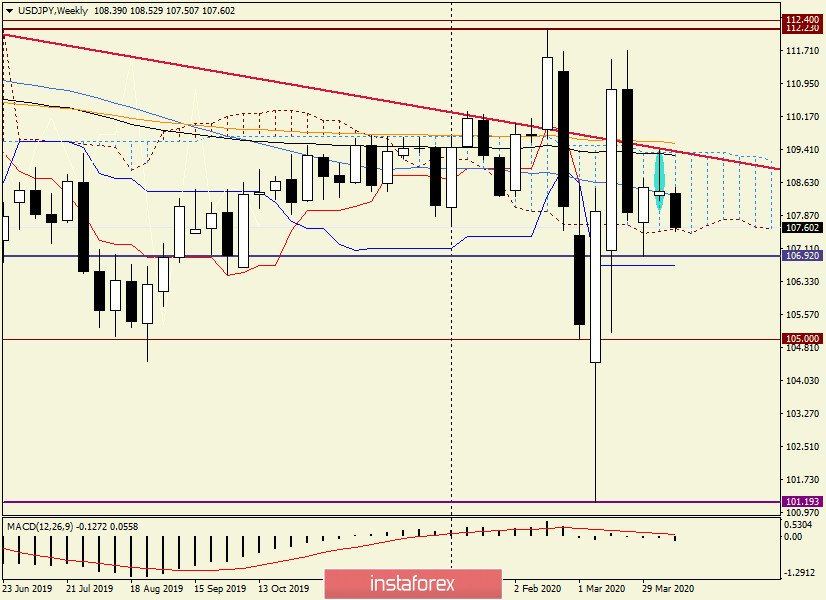
Weekly
Looking at the weekly chart, you come to the conclusion that the dollar/yen pair is not for nothing considered one of the most technical in the Forex currency market. In previous reviews of this instrument, the red resistance line drawn at points 125.84-114.55 was mentioned more than once. At the auction of the past five days, it again acted as a barrier to further growth. Although this line has already been cut by the price (the pair has been rising higher and falling lower) and its influence on the quote may have become less significant, this line still retains its strength as resistance.
Do not underestimate the importance of the upper border of the Ichimoku indicator cloud and the exponential moving average, which also stopped the pair's rise and contributed to a sharp rebound in the price downwards. As a result, a candle appeared, which in shape resembles a "tombstone" reversal pattern. And here the most important thing is where exactly this candle appeared. Most often, the "tombstone" model has a better chance of working out when it occurs at the end of an upward movement, at its peak or top. In this situation, such a candle appeared after trying to go up from the Ichimoku cloud, breakthrough the 89 EMA and again be above the red resistance line. Thus, with a high probability, it was possible to assume that at the current auction, the dollar/yen pair will turn in the south direction, which we are observing
If the decline continues and weekly trading ends under the lower border of the cloud, a good signal will be received about a long-term decline in the quote. In this case, the pair's attempts to return to the cloud should be considered for selling. But this is on a weekly scale. Let's see what happens in smaller time intervals.
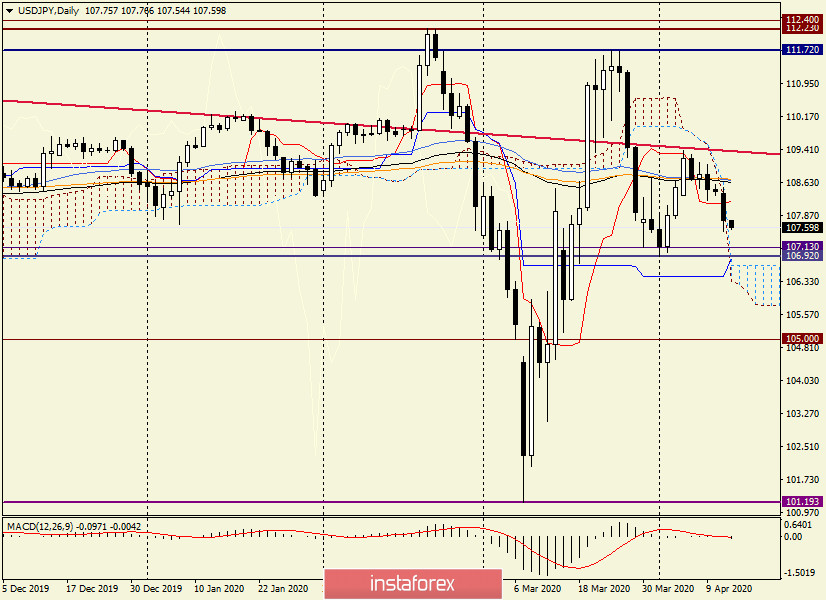
Daily
Here, the Tenkan line, as well as 50 MA, 89 EMA and 144 EMA played a significant role in the reversal to decline. Now, apparently, the quote may fall into a strong price zone near 107.00, but before that, it may give a pullback to the broken moving averages and the Tenkan line. If this happens, then after rising to the area of 108.20-108.70, we are preparing for sales. It is worth noting that this is a very strong technical zone, and a confirmation signal for opening short positions will be bearish candlestick patterns that will appear in the selected zone on the daily 4-hour or even hourly charts.
But if you decline to the level of 107.00, you will need to pay attention to the signals for purchases. If they appear, the zone for opening long positions is 107.15-106.95.
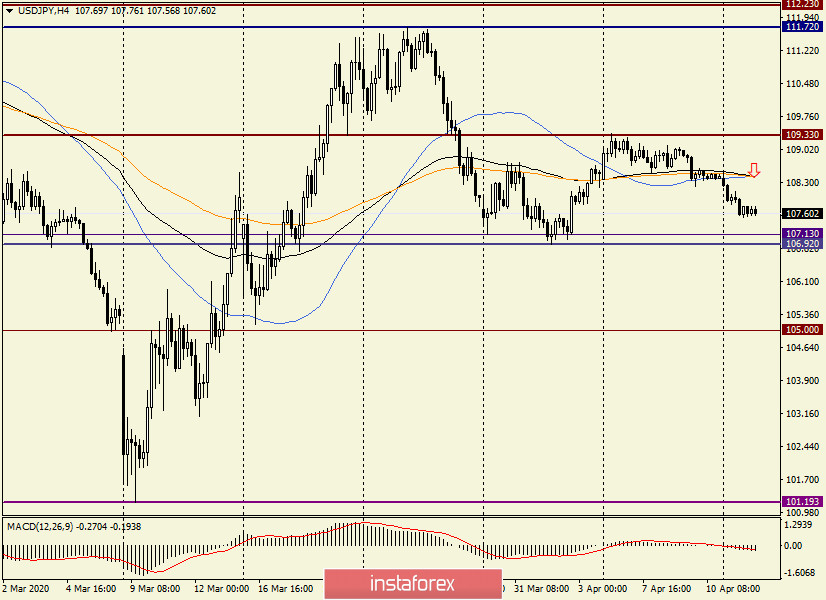
H4
In this timeframe, the idea of opening sales from a strong price area of 108.20-108.70 is confirmed. Moreover, due to the accumulation of used moving averages at 108.42, it is from this mark that I recommend opening deals for sale.
If the pair continues to decline from the current prices, then breaks through the support in the area of 107.13-106.92 and fixes lower, it is also worth trying to sell the dollar/yen pair on the pullback to the broken zone.
Necessary clarification: when describing the daily chart, the probability of purchases near the strong level of 107.00 was noted. This positioning will become relevant only after the appearance of daily reversal candle models consisting of one or more candles.
Good luck!