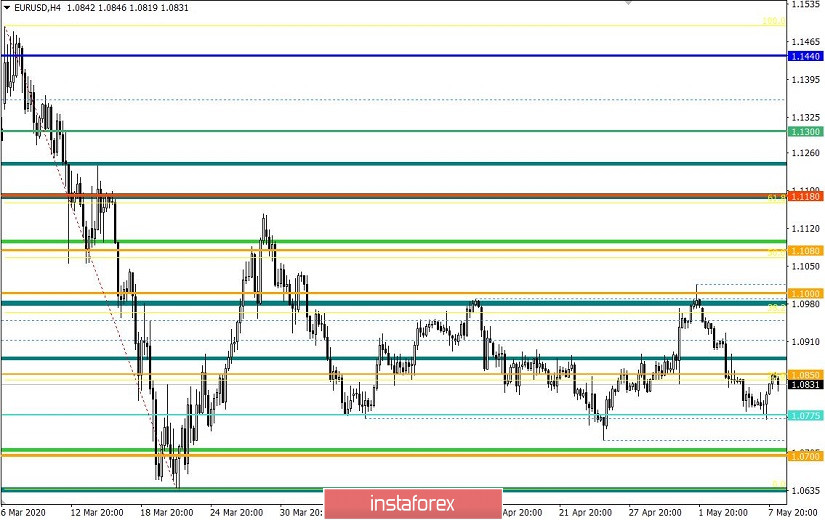
From the point of view of complex analysis, we see a rebound in prices from the range level, and now let's talk about the details. Most of the trading week passed in a downward direction and during which, the quote managed to decline to the level of 1.0775, and there was a slowdown on the basis of regularity and, as a fact, a corrective move towards the previously passed level of 1.0850. In fact, the level of 1.0775 still plays an integral role of the interaction of trading forces in the market, but at the same time, do not forget about the consistent measures that have a downward mood. Based on this logic, we can say that the level of 1.0775 serves as a temporary platform on which market participants concentrate, but this same platform can play the role of acceleration in the subsequent movement.
If we have a series of descending cycles, then the sellers' ownership in this structure is undeniable, which means that the level of 1.0775 can play in favor of acceleration, and its breakdown is just a moment of time that can occur at any moment.
It turns out that we are still inclined to the downward development and in this regard we are considering possible theories.
Looking at the past day by the minute, you can see that the quote was mostly concentrated near the 1.0750 level, but there was an acceleration during the time period of 15:00-17:00 UTC+00, in which long positions prevailed.
In terms of volatility, there is similar activity for the second day in a row, which is systematically lower than the daily average. Most likely, this is the signal of a kind of accumulation, which will later result in acceleration.
Regarding the monitoring of volatility, we see a gradual normalization of the emotional mood of market participants, where, for example, the average dynamics of the daily candle in March was 172 points, and already 90 points in April. Let me remind you that before the surge in panic, the average dynamics for the euro/dollar pair was 60 - 80 points.
Volatility detail
MARCH : Monday [March 9] - 155 points; Tuesday - 183 points; Wednesday - 115 points; Thursday - 278 points; Friday - 166 points; Monday - 151 points; Tuesday - 234 points; Wednesday - 243 points; Thursday - 326 points; Friday - 194 points; Monday - 191 points; Tuesday - 160 points; Wednesday - 133 points; Thursday - 188 points; Friday - 194 points; Monday - 134 points; Tuesday - 127 points.
APRIL : Wednesday - 136 points; Thursday - 147 points; Friday - 91 points; Monday - 67 points; Tuesday - 142 points; Wednesday - 72 points; Thursday - 110 points; Friday - 33 points; Monday - 74 points; Tuesday - 84 points; Wednesday - 134 points; Thursday - 95 points; Friday - 80 points; Monday - 55 points; Tuesday - 64 points; Wednesday - 82 points; Thursday - 90 points; Friday - 101 points; Monday - 49 points; Tuesday - 79 points; Wednesday - 68 points; Thursday - 139 points.
MAY : Friday - 83 points; Monday - 79 points; Tuesday - 100 points; Wednesday - 63 points; Thursday - 67.
The average daily indicator relative to the dynamics of volatility is 85 points [see table of volatility at the end of the article].
As discussed in the previous review, traders in terms of main deals considered a downward development, but only after the price consolidated below 1.0775, which did not happen.
Thursday's recommendations coincided by 200%, more specifically, profits were collected both from positions for sale and from positions for purchase.
[We consider selling positions lower than 1.0790, down to 1.0775. Further progress is made after fixing the price lower than 1.0770, with a prospect of 1.0730–1.0700.
We consider purchase positions in terms of local operations higher than 1.0826, with a movement towards 1.0850.]
Considering the trading chart in general terms, the daily period, you can notice just those very consistent downward bars, as mentioned above. However, do not forget about the global trend that remains on the market.
The news background of the past day contained data on applications for unemployment benefits in the United States, where the next historical records were waiting for us. So, the initial applications amounted to 3 169 000, which is better than forecasts in some sense, but it is extremely difficult to be aware of such enormous values. In turn, repeated applications totaled 22,647,000, which is higher than the forecast.
The market's reaction to such significant indicators was literally absent, and this is understandable. The market, represented by investors, was ready for them, and the head of the Federal Reserve Bank of St. Louis James Bullard said the other day that the ADP report is not surprising.
In terms of the general informational background, we see the forgotten process of trade negotiations between the US and China, which at the beginning of the year concluded an agreement on the implementation of the first part of the trade agreement. So, during a telephone conference in which such persons as: Vice-Premier of the State Council of the People's Republic of China L. He, Trade Representative of the United States R. Lighthizer and US Treasury S. Mnuchin, said that the need to strengthen cooperation and prevent the collapse of those agreements that have already been reached. Let me remind you that in connection with the coronavirus pandemic, the implementation of the first part of the trade agreement has become questionable, the obligations of the parties, in particular China, are not fulfilled in the volumes established by the agreement. Against this background, there is a discontentment of the American side, in particular President Donald Trump, who threatens to terminate the agreements that were reached.
Against this background, we see a local weakening of the US dollar.
Today, in terms of the economic calendar, we have the report of the United States Department of Labor, where we are waiting for another shock. So, based on forecasts, the unemployment rate could rise from 4.4% to 15.5%, which will be considered the highest rate in 72 years. At the same time, employment could be reduced by 21,780,000, which will also be considered a historical record.
In turn, regarding the upcoming report, the head of the Federal Reserve Bank of Minneapolis, Neel Kashkari, has already managed to speak out, saying that the ministry may underestimate the figures and the real unemployment rate may reach 23%.
In terms of the economic calendar, the upcoming trading week contains a number of macroeconomic data for March / April in Europe and the United States, which will continue to reflect the effects of quarantine measures on the economies of countries.
The most interesting events displayed below --->
Tuesday, May 12
USA 12:30 Universal time - Inflation data for April
Wednesday, May 13
EU 9:00 Universal time - Industrial production in March
USA 12:30 Universal time - Producer Price Index (PPI), for April
Thursday, May 14
EU 06:00 Universal time - Inflation data for April in Germany
EU 9:00 Universal time - unemployment rate (Mar)
USA 12:30 Universal time - Applications for unemployment benefits
Friday May 15
EU 9:00 Universal time - GDP Q1 PRELIMINARY
EU 9:00 Universal time - unemployment rate Q1 PRELIMINARY
USA 12:30 Universal time - Retail
Further development
Analyzing the current trading chart, we see that the quote with surgical accuracy slowed down the movement within the level of 1.0850, where a recovery began to occur relative to yesterday's jump. So, a variable fluctuation cannot lead to a change in the clock component, which means that the general mood of the market will be preserved and we will soon see the level of 1.0775 again and, finally, we will pass it.
It is difficult to say whether the report of the US Department of Labor can affect the general direction, but what we can definitely repeat again is Bullard's words - "it is not a surprise". Thus, the reaction of the market report may be across the principle of fundamental analysis.
It can be assumed that if the specified mood is maintained from the level of 1.0850, the quote will continue to decline towards the subsequent level of 1.0775. Otherwise, chatter along the level of 1.0850 is not excluded.
Based on the above information, we derive trading recommendations:
- We consider selling positions lower than 1.0815, declining to 1.0775. Further progress is made after the price consolidates lower than 1.0770, with a prospect of a move to 1.0730 - 1.0700.
- We consider buying positions in terms of local operations higher than 1.0860, with a movement towards 1.0885 - 1.0900
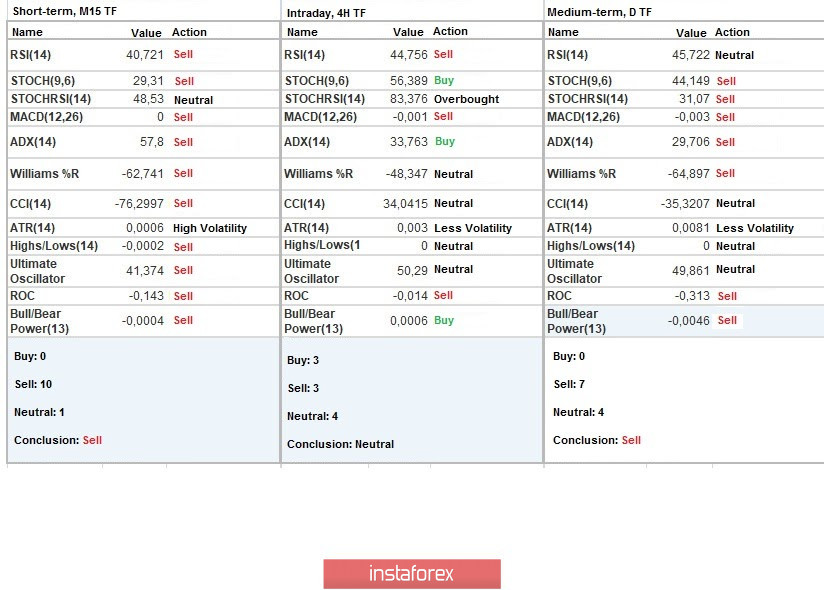
Indicator analysis
Analyzing a different sector of time frames (TF), we see that the correction course has led to small changes in the readings of technical instruments, where the hour periods now reflect a neutral signal, and the daily sections retain their original direction.
Volatility per week / Measurement of volatility: Month; Quarter; Year
Measurement of volatility reflects the average daily fluctuation calculated for Month / Quarter / Year.
(May 8 was built taking into account the time of publication of the article)
The volatility of the current time is 35 points, which is a low indicator relative to the average daily value. Based on the information and news background, it can be assumed that the activity of market participants may grow, which will affect volatility.
Key levels
Resistance zones: 1.0850 **; 1.0885 *; 1.1000 ***; 1.1080 **; 1,1180; 1.1300; 1.1440; 1.1550; 1.1650 *; 1.1720 **; 1.1850 **; 1.2100
Support Areas: 1.0775 *; 1.0650 (1.0636); 1.0500 ***; 1.0350 **; 1.0000 ***.
* Periodic level
** Range Level
*** Psychological level