What is needed to open long deals on EUR/USD
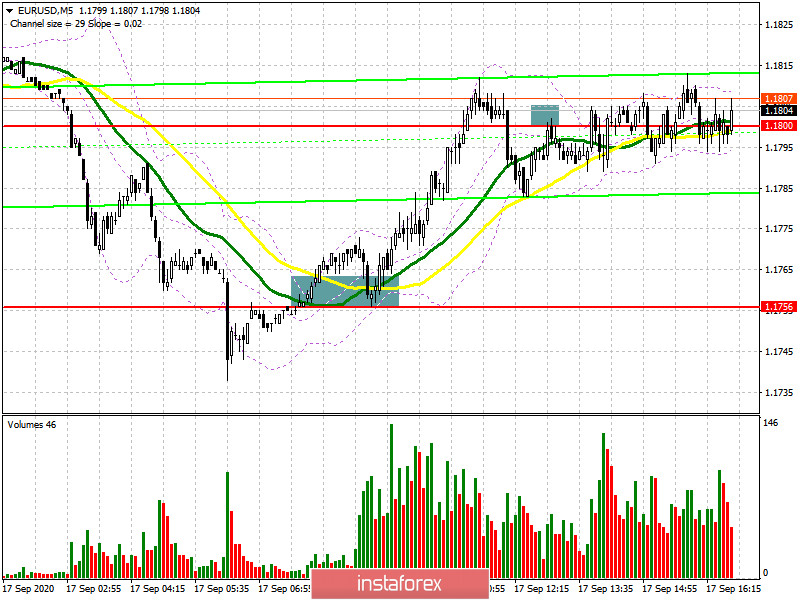
If you read my morning outlook, you found out that I recommended opening long positions on EUR/USD after a fake breakout of 1.1756. This is what actually happened. Make sure you look carefully at the 5-minute chart. You discover from the chart that the bulls are fighting for the area of 1.1756 and then testing it downwards. This is creating an excellent entry point for long positions that have already generated a profit of almost 45 pips. On the other hand, we should not neglect the euro sellers who were making efforts to take control of the market. After the pair rebounded to the level below 1.1810, the sellers wanted to create the entry point for short deals, but this idea failed.
Speaking about new long positions, the resistance level changed a bit in the second half of the day. Now is it seen at the level slightly above 1.1810. A breakout and fixation above this level will ensure a good entry point for long deals on the euro with the target level of 1.1852. In other words, the price will retrace upwards to the recent high where I recommend profit taking. More patient buyers of EUR/USD are going to wait until the price rebounds to 1.1900. During the American session, the US is due to release some fundamental data. So, if EUR again gets under pressure tonight, it would be better to postpone long deals until support is confirmed at 1.1756 in the morning. The pair could be bought there on price dips bearing in mind an intraday correction of 20-30 pips.
What is needed to open short deals on EUR/USD
The sellers aim to defend resistance at 1.1810 because its breakout will open the door for the broad-based growth of EUR. Meanwhile, the pair is trading below 1.1810. So, the sellers are guided by the sell signal which was formed in the first half of the trading day. A fake breakout of 1.1810 will reinforce the sellers' confidence. The bears set the goal to push the price down towards support at 1.1756 where I recommend profit taking. In case the upward correction of EUR/USD is going on and the buyers are struggling to take control of the market, it would be better to refrain from selling the pair. The best option is to wait until 1.1852 is tested. Then, you will be able to sell EUR from there on rallies bearing in mind an intraday correction of 20-30 pips.
Signals of technical indicators
Moving averages
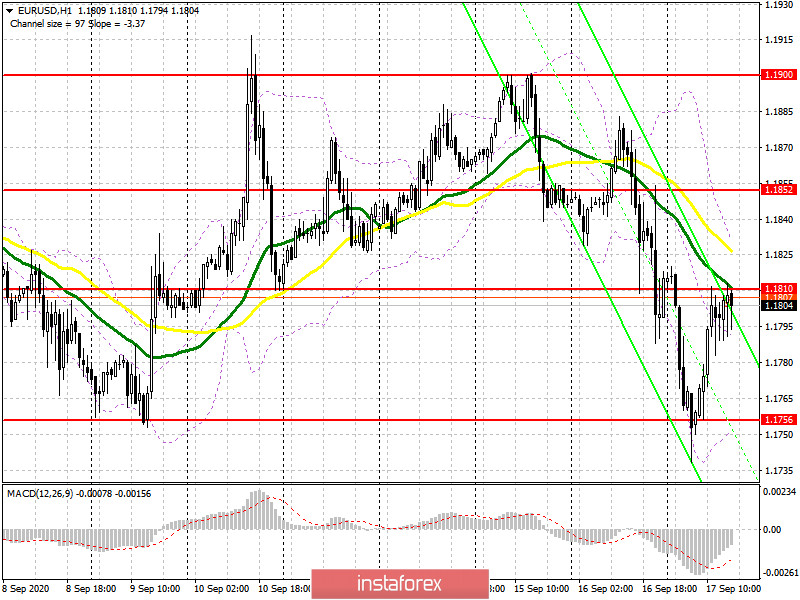
The pair is trading below 30- and 50-period moving averages which are now serving as an extra resistance level for EUR buyers.
Remark. The author is analyzing a period and prices of moving averages on the 1-hour chart. So, it differs from the common definition of classic daily moving averages on the daily chart.
Bollinger Bands
EUR growth will be capped by the upper level of the indicator at near 1.1835. In case EUR declines, the lower border of the indicator at near 1.1755 will act as support.
Definitions of technical indicators
- Moving average recognizes an ongoing trend through leveling out volatility and market noise. A 50-period moving average is plotted yellow on the chart.
- Moving average identifies an ongoing trend through leveling out volatility and market noise. A 30-period moving average is displayed as the green line.
- MACD indicator represents a relationship between two moving averages that is a ratio of Moving Average Convergence/Divergence. The MACD is calculated by subtracting the 26-period Exponential Moving Average (EMA) from the 12-period EMA. A 9-day EMA of the MACD called the "signal line".
- Bollinger Bands is a momentum indicator. The upper and lower bands are typically 2 standard deviations +/- from a 20-day simple moving average.
- Non-commercial traders - speculators such as retail traders, hedge funds and large institutions who use the futures market for speculative purposes and meet certain requirements.
- Non-commercial long positions represent the total long open position of non-commercial traders.
- Non-commercial short positions represent the total short open position of non-commercial traders.
- The overall non-commercial net position is the difference between short and long positions of non-commercial traders.