Despite Friday's publication of the most important US labor statistics, the USD/JPY currency pair did not show a pronounced directional dynamics last week. Before reviewing the price charts of the dollar/yen pair, let me remind you about the status of both currencies. As you know, the Japanese yen is a traditional protective asset and is considered by market participants as a safe haven currency. At the same time, the yen is most popular in times of geopolitical crises and natural disasters. To a lesser extent, the demand for the Japanese currency is observed during economic crises. The US dollar has been the world's main reserve currency for a very long time, which does not prevent it from being in demand as a protective asset.
During the invasion of the COVID-19 pandemic, it was the US dollar that was given the greatest preference by investors. I believe that this is due to the huge risk of a new global financial and economic crisis due to the closure of many enterprises and the introduction of a large number of restrictive measures. Nevertheless, both the Swiss franc and the Japanese yen occasionally seized the initiative from the "American" and became safe havens. In my opinion, in addition to the flow of capital, this trend is also due to technical factors.
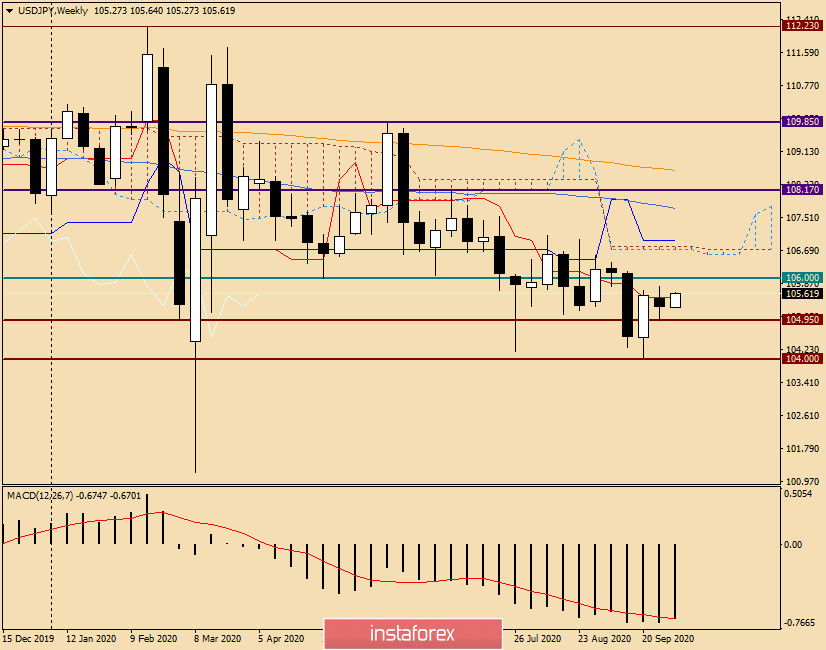
Weekly
As you can see, the USD/JPY pair declined slightly at last week's trading. It can be assumed that this outcome of trading was predetermined by mixed data on the US labor market, as well as market participants' fears that the White House administration will not be able to agree with the Democrats in the House of Representatives on a new bill to support the US economy from the consequences of COVID-19. Let me remind you that a new draft law on stimulus measures has been proposed in the amount of $ 1.5 trillion. Previously, the size of the package was 2.2 trillion, however, the vote on it was postponed.
The pair spent the last five days trading in the range of 105.00-106.00, and to be more precise, the trading range was 105.81-104.95. Thus, the assumptions made earlier that the pair may get bogged down near a strong significant technical and psychological level of 105.00, at this stage of time, are confirmed. If the pair breaks the mark of 106.00, the movement will continue to the price zone of 106.70-107.00, where both borders of the Ichimoku indicator cloud and the Kijun line pass. I don't see any sense in talking about longer-term goals at the top, since the bulls on the pair first need to overcome the resistance of sellers near 106.00. The bulls have an equally difficult task for the instrument - this is a true breakdown of the landmark mark of 105.00. We see that during the last five-day trading, such attempts were made, however, it was not possible to lower the quote below 104.95.
If the breakout of 105.00 still takes place, the next targets of the pair will be the price zone of 104.30-104.00, where there is also a fairly strong support.
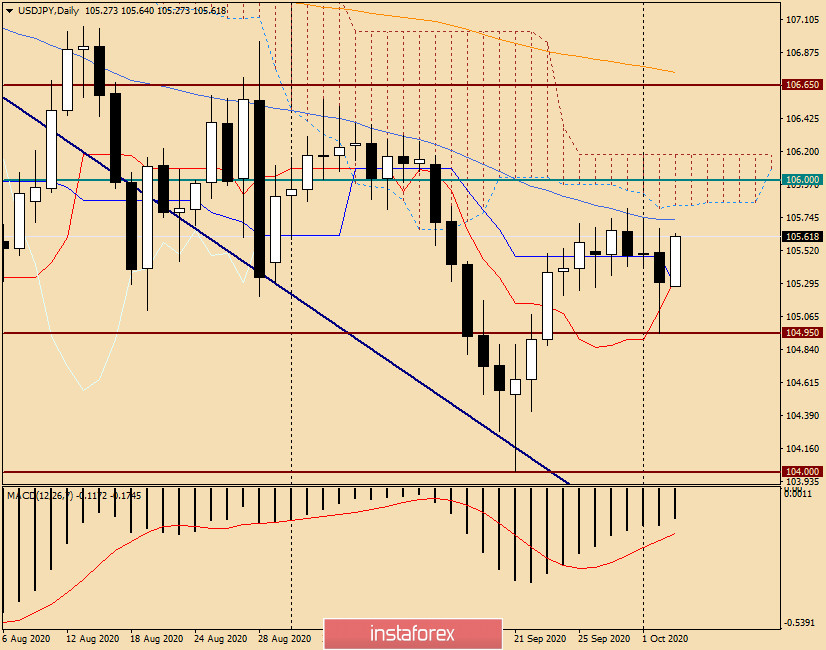
Daily
On the daily chart, after the formation of a Friday candle with a long lower shadow, at the end of the review, the pair is actively growing. Apparently, the market did not want to decline and trade at 105.00. Now, if the upward trend continues, the USD/JPY bulls will have to face the 50 simple moving average, which runs at 105.73. A true breakout of 50 MA will target the quote to the resistance area of 106.00-106.15, a breakout of which will open the way to higher prices. If the current bullish sentiment changes, the dollar/yen will re-test the strength of the mark of 105.00. If this level can be broken, the quote is expected to continue the bearish scenario.
In this situation, both purchases and sales remain relevant. I recommend that you take a closer look at opening short positions after the growth in the price area of 105.73-106.13, which will be confirmed by the candlestick signals on the 4-hour and hourly timeframes. You can try buying in the case of a decline in the area of 105.50-105.00, where bullish patterns of Japanese candlesticks on smaller time intervals will also be a signal for opening long positions.