To open long positions on EUR/USD, you need:
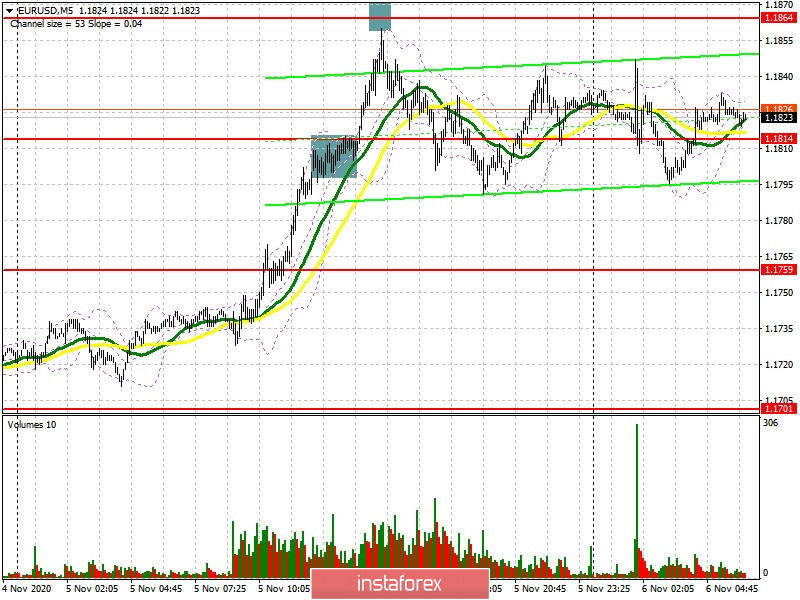
I mentioned placing buy positions above 1.1814 and selling from a large high yesterday afternoon, which is what happened. Let's take a look at the 5-minute chart and break down the entry points. After the pair began to slowly exert pressure on the 1.1814 level in the afternoon, its breakdown took place, which caused EUR/USD to rise by 60 points. We had the same signal in the morning after the breakout of 1.1765. Short positions immediately on the rebound from the resistance of 1.1864 were also absolutely correct. But the pair was just a couple of points short of reaching this high, so I personally missed this deal.

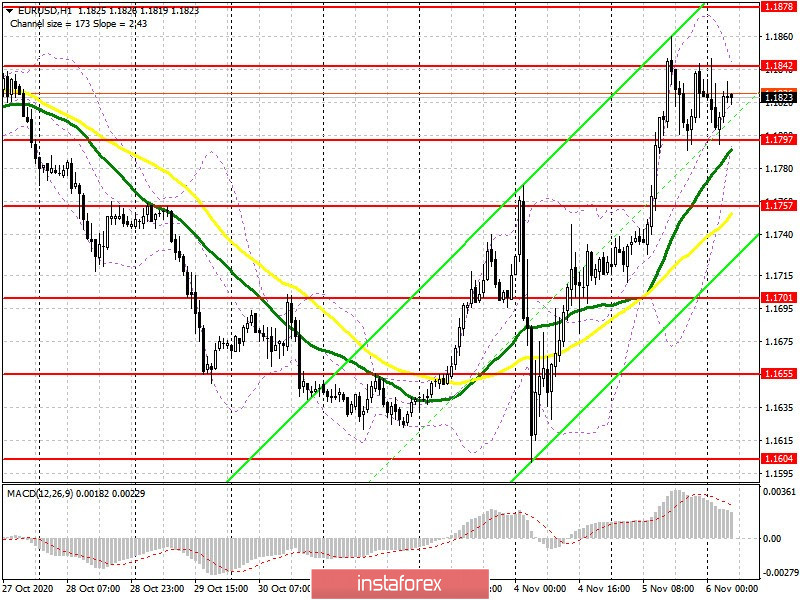
Buyers are currently focused on going beyond the 1.1842 high and there are plenty of reasons for that today. The intrigue of winning the US presidential election remains, but Biden has an advantage, so a breakout and getting the pair to settle above 1.1842 is a signal to open long positions in hopes of reaching highs of 1.1878 and 1.1915, where I recommend taking profits. The US labor market report will be released in the afternoon, which could return the demand for the US dollar. Therefore, in case the pair falls, a false breakout in the support area of 1.1797, where the moving averages pass playing on the side of buyers, will be a signal to open long positions. I advise you to buy EUR/USD immediately on a rebound only from a low of 1.1757, counting on a rebound of 15-20 points within a day.
To open short positions on EUR/USD, you need:
Sellers need to protect resistance at 1.1842, as well as the larger level of 1.1878, when tested, a divergence may form on the MACD indicator, which will lead to forming a downward correction for the pair. Forming a false breakout at 1.1842 will also be a signal to open short positions. A more important task for euro sellers is to go beyond and settle below support at 1.1797. Testing it from the other side forms a fairly good sell signal in hopes to fall to a low of 1.1757. Support at 1.1701 will be the next goal, which is where I recommend taking profit. Many important fundamental reports will be released today, including the data that everyone is waiting for - the results of the US elections, so volatility promises to be very large. So don't forget to place stop orders.
The Commitment of Traders (COT) report for October 27 showed a reduction in both long and short positions. Despite this, buyers of risky assets believe that the bull market will continue and so they prefer to act with caution. Thus, long non-commercial positions fell from 229,878 to 217,443, while short non-commercial positions also fell to 61,888 from 63,935. The total non-commercial net position decreased to 155,555 from 165,943 a week earlier. However, the bullish sentiments for the euro remains rather high in the medium term. The more the euro will decline against the US dollar at the end of this year, the more attractive it will be for new investors, especially following the US presidential elections, when additional pressure on the market on this issue eases.
Indicator signals:
Moving averages
Trading is carried out above 30 and 50 moving averages, which indicates continued growth in the euro.
Note: The period and prices of moving averages are considered by the author on the H1 hourly chart and differs from the general definition of the classic daily moving averages on the D1 daily chart.
Bollinger Bands
A breakout of the upper border of the indicator around 1.1845 will lead to a new wave of euro growth. A breakout of the lower border of the indicator around 1.1797 will increase the pressure on the pair.
Description of indicators
- Moving average (moving average, determines the current trend by smoothing out volatility and noise). Period 50. It is marked in yellow on the chart.
- Moving average (moving average, determines the current trend by smoothing out volatility and noise). Period 30. It is marked in green on the chart.
- MACD indicator (Moving Average Convergence/Divergence — convergence/divergence of moving averages) Quick EMA period 12. Slow EMA period to 26. SMA period 9
- Bollinger Bands (Bollinger Bands). Period 20
- Non-commercial speculative traders, such as individual traders, hedge funds, and large institutions that use the futures market for speculative purposes and meet certain requirements.
- Long non-commercial positions represent the total long open position of non-commercial traders.
- Short non-commercial positions represent the total short open position of non-commercial traders.
- Total non-commercial net position is the difference between short and long positions of non-commercial traders.