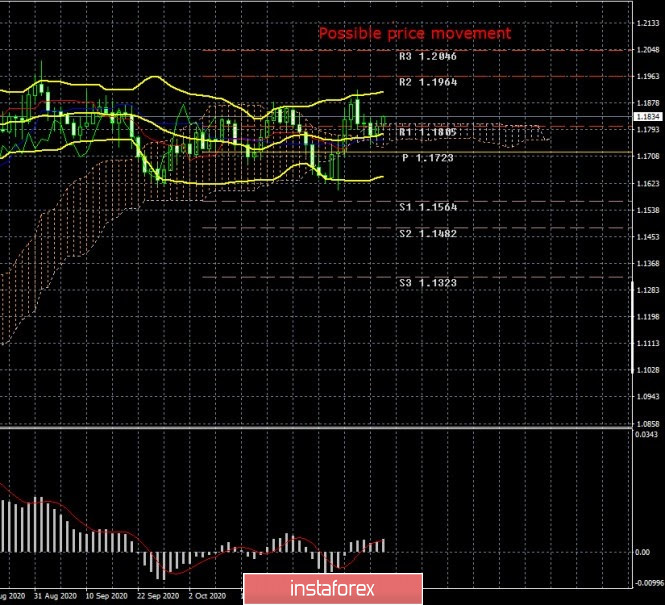
EUR/USD - 24H.

Over the past week, the EUR/USD pair has fallen by 50 points. It is even better to say that the European currency has fallen by 50 points. Thus, during the day, the trend was still absent, and trading took place between the levels of 1.1700 and 1.1900, between which the pair is trading (at least) for three months now. In the most long-term perspective, therefore, the flat persists. And even the US presidential election and its results could not force traders to withdraw the pair from this range. From a technical point of view, there's not much to say right now. All lines of the Ichimoku indicator on the 24-hour timeframe are not strong, and therefore, bounces from them and overcoming them do not have any weight. They are not signals to trade on. The Bollinger Bands are now directed sideways, thus, we have a huge amount of evidence of a side channel. Thus, traders will continue to trade between the borders of the side channel using lower timeframes. Or wait for the flat to finish and the euro/dollar pair to exit the side channel.
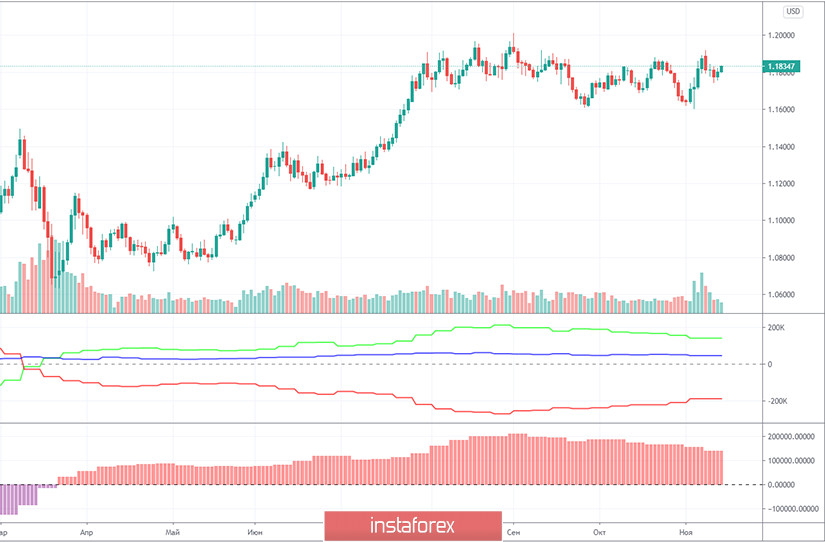
The COT report.
During the last reporting week (November 3-9), the EUR/USD pair increased by 170 points. The presidential election in America provoked a fairly strong drop in the US currency, however, it lasted no more than a few days. Nevertheless, the euro currency still rose in price, and market participants could count on a change in the mood of professional traders to a more "bullish" one. However, the latest COT report again showed that the mood of major traders has become more "bearish". The net position of the "Non-commercial" group of traders decreased again, this time by 17,000 contracts, which is quite a lot. Recall that non-commercial traders have been reducing their net position for several weeks in a row, which is eloquently indicated by the lower indicator in the illustration. A decrease in the net position means that the closing of buy-contracts and the opening of sell. The first professional traders in the reporting week closed 9.2 thousand, and the second - opened 7.8 thousand. However, although the net position of non-commercial traders has been falling since the beginning of September, the downward trend for the euro/dollar pair still does not begin. The green and red lines on the first indicator continue to move towards each other, which means that the trend has long started. However, there is no downward movement in the long term. Thus, based on the latest COT report, we can say the following: our forecasts remain the same since the reported data only allows us to draw such conclusions. We still believe that the upward trend ended around the 1.2000 level.
What can we say about the fundamental background of the past trading week? A large number of important macroeconomic reports were published during the week. However, most of them were ignored again. There were several speeches by the heads of the central banks of the European Union and the United States, however, they did not contain any important information. Christine Lagarde and Jerome Powell talked more about Pfizer's new vaccine and the prospects for their economies if mass vaccination starts. And both heads of the Central Bank agreed that the positive effect of creating a vaccine will not be visible in the coming months. It may take months for the vaccine to be fully approved, for it to go into mass production, for it to be delivered to all end-users, given the number of doses that need to be produced. The topic of the presidential election has left the front pages of periodicals. In most states, all votes are counted, so it's safe to say that Joe Biden won the election, as predicted. The Democrat won about 279 "electoral votes", while Trump won 214. Thus, even a review of the results in one or two states will not allow Trump to turn the election results upside down. It turns out, even to sue for nothing. The Trump team, of course, filed lawsuits in the courts of many states with requests to recount the votes, not taking into account the votes received after November 3-4 (by mail) and other claims. However, most of the claims were rejected for insufficient evidence. Thus, Trump lost and, in our humble opinion, lost on all fronts, as it should have been. Even though Trump is probably not the worst President in the history of the United States, he still did not give the main thing that was expected of him – the result. And most importantly, there is no trust in him. Various agencies' calculations of the number of times Trump misled or outright lied with his comments or statements are the "cherry on the cake" of Trump's presidency. According to various estimates, the American President lied at least 14 times a day.
Trading plan for the week of November 16-20 October:
1) The pair's quotes continue to trade in the side channel. It will be possible to talk about the resumption of the upward trend no earlier than overcoming the previous local maximum near the level of 1.2000. Until then, it is recommended to continue trading inside the side channel using lower timeframes.
2) To be able to sell the EUR/USD pair, you need to at least wait for the price to consolidate below the Kijun-sen and Senkou Span B lines. But even in this case, the potential for a downward movement is limited to the level of 1.1700. In this way, you can look for short-term trends on lower timeframes, but keep in mind that in the most long-term plan, it is the flat that remains.
Explanation of the illustrations:
Price levels of support and resistance (resistance/support) – target levels when opening purchases or sales. You can place Take Profit levels near them.
Ichimoku indicators, Bollinger bands, MACD.
Support and resistance areas – areas that the price has repeatedly bounced from before.
Indicator 1 on the COT charts – shows the net position size of each category of traders.
Indicator 2 on the COT charts – the net position size for the "Non-commercial" group.