To open long positions on EUR/USD, you need:
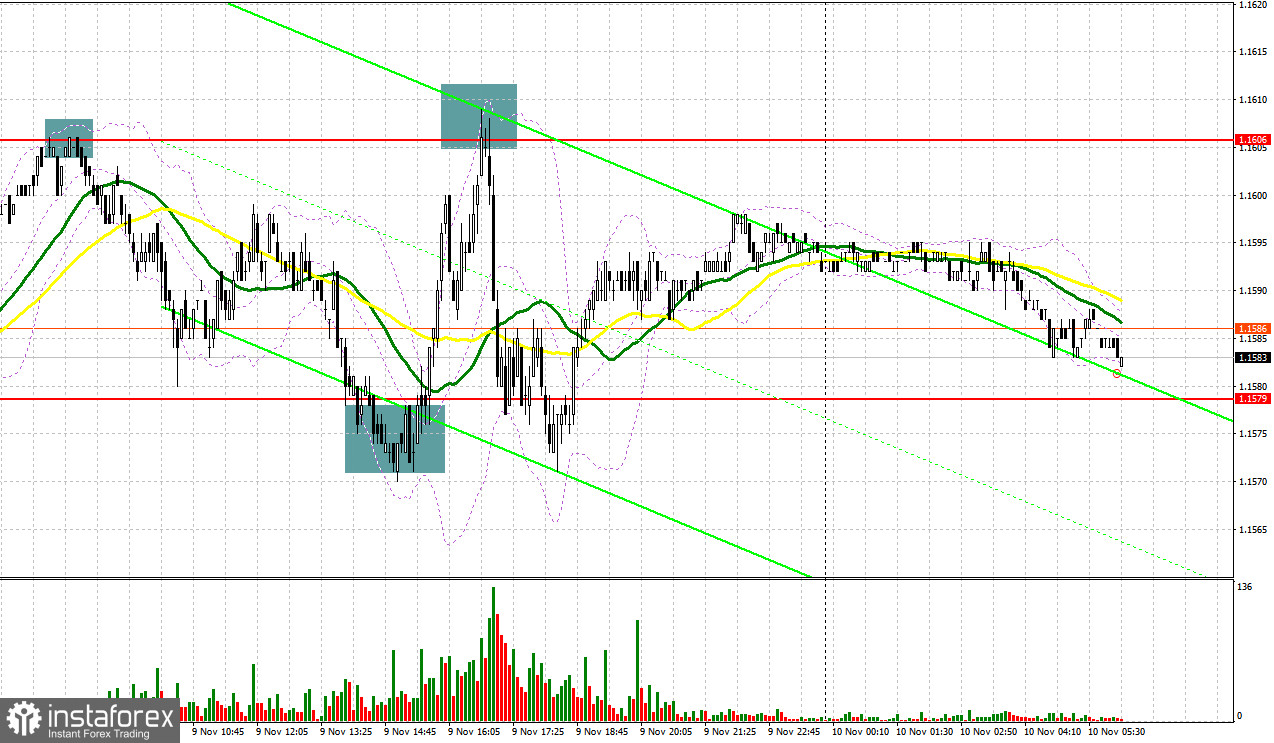
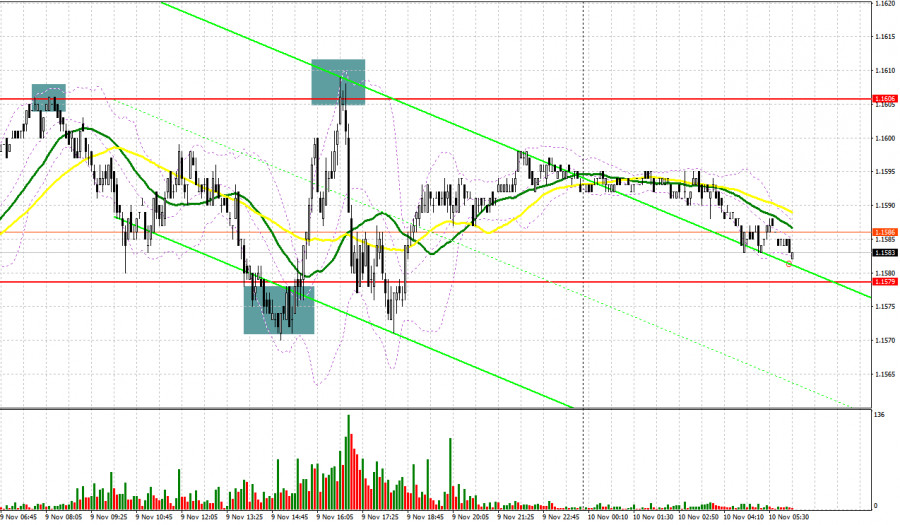
Quite a lot of signals to enter the market were formed yesterday. Let's take a look at the 5 minute chart and understand the trades. In my morning forecast, I paid attention to the 1.1606 level and advised you to make decisions on entering the market. On the one hand, good data on the indicator for assessing business sentiment in Germany and the eurozone supported the euro, on the other hand, on closer examination of the indicator, a sharp decline in the current situation did not allow the bulls to rise above 1.1606. As a result, a false breakout was formed and a signal to open short positions was formed, which pushed the euro down to the support area of 1.1579. A false breakout was formed at this level in the second half of the day, which resulted in forming a buy signal. It was realized by rising back to the resistance area of 1.1606, making it possible to take another 25 points from the market. Strong data on US producer prices and the Federal Reserve report during the US session led to a false breakout in the 1.1606 area, similar to the morning entry point, and to a sell signal - another +25 points.
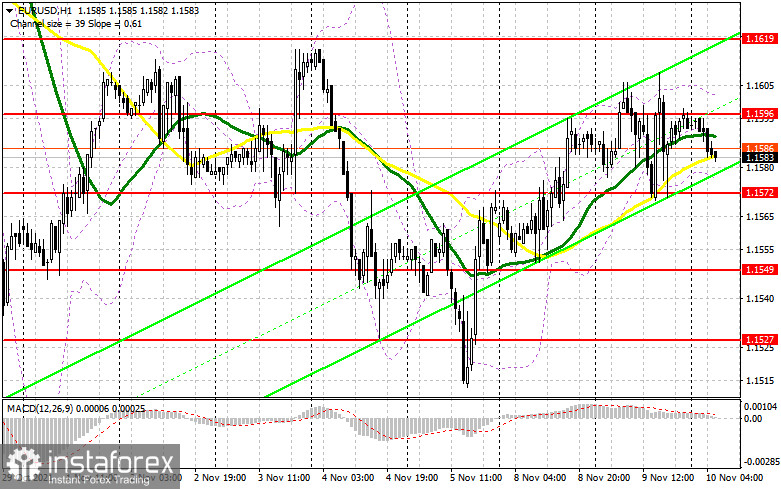
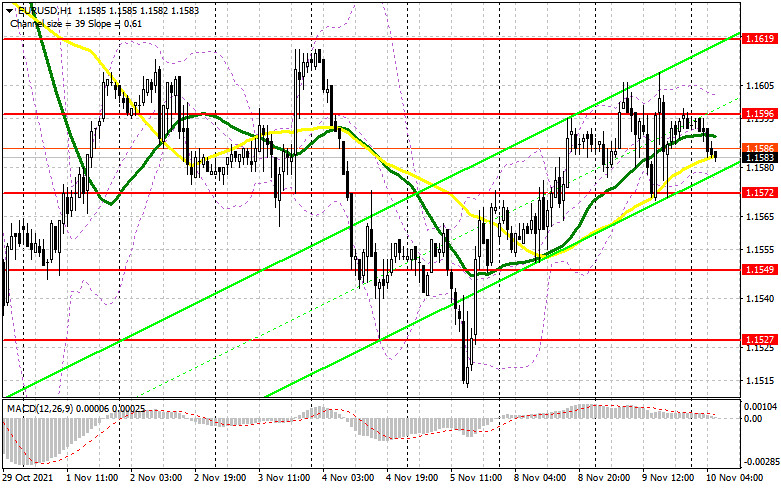
From a technical point of view, little has changed and most likely traders will focus on today's data for Germany and the United States. A report on the consumer price index will be published in the morning, which may lead to a surge in market volatility. The bulls will expect to go beyond the 1.1596 level. But only a reverse test from top to bottom of this range, along with strong inflation in Germany, will provide a point of entry into long positions, counting on the growth of EUR/USD to the 1.1619 area. A breakthrough of this range will entirely depend on the fundamentals of the American economy and the statements of representatives of the European Central Bank. The 1.1619 test from top to bottom will lead to another signal to buy and the growth of EUR/USD to the area of a new high like 1.1646, where I recommend taking profits. If the pressure on the pair persists in the first half of the day, forming a false breakout in the 1.1572 area, by analogy with the long position, which I analyzed above, will provide an excellent signal to open long positions with an upward correction as the goal. In case traders are not active at 1.1572, it is best to wait for the formation of a false breakout in the 1.1549 area, but you can open long positions in EUR/USD immediately for a rebound from a low like 1.1527, counting on a correction of 15-20 points within the day.
To open short positions on EUR/USD, you need:
The bears did not achieve their target, failing to settle below the 1.1580 level, which has now transformed into the 1.1572 support. Today's speeches by ECB representatives and data on inflation in the eurozone countries may lead to another surge in volatility. Therefore, the entire calculation in the first half of the day will be on weak reports on the eurozone. The bears' initial target is to protect the resistance at 1.1596. Forming a false breakout there creates the first signal to open short positions, which will provide an excellent point in the market with the goal of falling to the support of 1.1572, below which it was not possible to break below it yesterday. Only a breakthrough and test of this area from the bottom up will increase pressure on EUR/USD, which will open the way to the lows: 1.1549 and 1.1527. I recommend taking profits on short positions there. If the euro rises during the European session and the bears are not active around 1.1596, I advise you to postpone short positions until the next resistance test at 1.1619. But even there, it is best to open short positions after forming a false breakout. The best option for selling EUR/USD immediately on a rebound will be a high around 1.1646. You can count on a downward correction of 15-20 points.
I recommend for review:
The Commitment of Traders (COT) report for November 2 revealed a decrease in both long and short positions, which led to a negative delta since more sellers had exited the market than buyers. The monetary policy meetings of the leading central banks last week had a minor impact on the market. The Fed's stance on monetary policy boosted investors' optimism and restored faith in the continuing economic recovery. At the same time, expectations that the ECB, despite all its statements, will have to tighten its policy soon amid rising inflation give EUR a chance to recover in the intermediate term. With each new fall in price, demand for the euro increases. Tomorrow, the United States will deliver its inflation report. The greenback's future movement versus its main counterparts depends on its outcome. According to the COT report, long non-commercial positions declined to 191,496 from 196,880 and short non-commercial positions fell to 197,634 from 208,136. The total non-commercial net position recovered slightly to -6,388 versus -11,256. The weekly closing price dropped to 1.1599 from 1.1608.
Indicator signals:
Trading is carried out in the area of 30 and 50 day moving averages, which indicates some market uncertainty.
Moving averages
Note: The period and prices of moving averages are considered by the author on the H1 hourly chart and differs from the general definition of the classic daily moving averages on the daily D1 chart.
Bollinger Bands
In case of growth, the upper border of the indicator in the area of 1.1600 will act as a resistance. A breakout of the lower border of the indicator in the area of 1.1579 will increase pressure on the euro.
Description of indicators
- Moving average (moving average, determines the current trend by smoothing out volatility and noise). Period 50. It is marked in yellow on the chart.
- Moving average (moving average, determines the current trend by smoothing out volatility and noise). Period 30. It is marked in green on the chart.
- MACD indicator (Moving Average Convergence/Divergence — convergence/divergence of moving averages) Quick EMA period 12. Slow EMA period to 26. SMA period 9
- Bollinger Bands (Bollinger Bands). Period 20
- Non-commercial speculative traders, such as individual traders, hedge funds, and large institutions that use the futures market for speculative purposes and meet certain requirements.
- Long non-commercial positions represent the total long open position of non-commercial traders.
- Short non-commercial positions represent the total short open position of non-commercial traders.
- Total non-commercial net position is the difference between short and long positions of non-commercial traders.