The main reason for a decline in EUR/USD
Greeting everyone!
Following the trading session on November 15-19, the euro/dollar pair incurred considerable losses. Let's try to figure out the reasons for such a significant drop, taking into account external factors. To start with, Europe is facing a new wave of the coronavirus pandemic The aggravation of the epidemiological situation occurred in Germany and Austria. Given the high probability of a new lockdown in Germany, the risks of a slowdown in the eurozone economic recovery are increasing. As a result, the euro is weakening across the board. Traders refrain from opening new positions on the single currency as they are now shifting their attention to safe-haven assets. Usually, when the epidemiological situation worsens, traders invest in the US dollar. If there is a surge in coronavirus cases in other European countries, primarily in France, Italy, and Spain, the euro may plunge. At the same time, demand for safe-haven currencies will grow even more.
Apart from that, the US dollar gained momentum following the speeches of FOMC members. The tone of their comments became more hawkish. Following Bostic, Evans, and Williams' speeches, Christopher Waller also made hawkish statements. "The rapid improvement in the labor market and the deteriorating inflation data have pushed me towards favoring a faster pace of tapering and a more rapid removal of accommodation in 2022," Waller said. In addition, Waller repeated his view that the Fed's balance sheet should eventually be reduced. Thus, more and more Fed policymakers speak in favor of tightening monetary policy, which is bullish for the US dollar,
As for the economic calendar, the most bust day of this week will be Wednesday. The US will unveil revised US GDP data for the 3rd quarter, while the Fed will reveal its meeting minutes. Many analysts believe that the minutes will reveal that the number of hawks has increased. Let's look at the technical indicators of EUR/USD on the weekly chart.
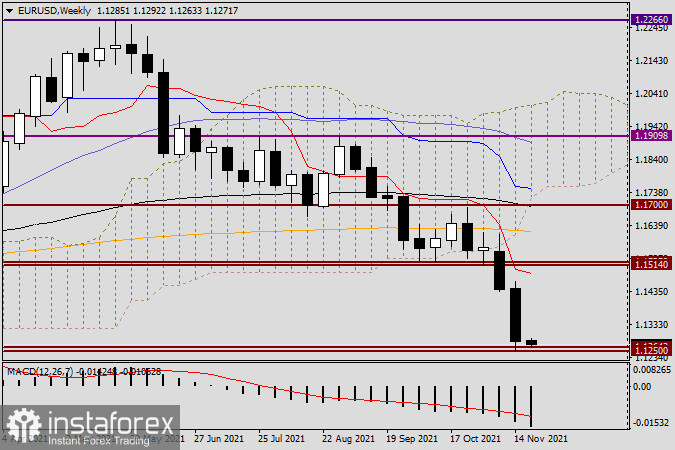
Weekly
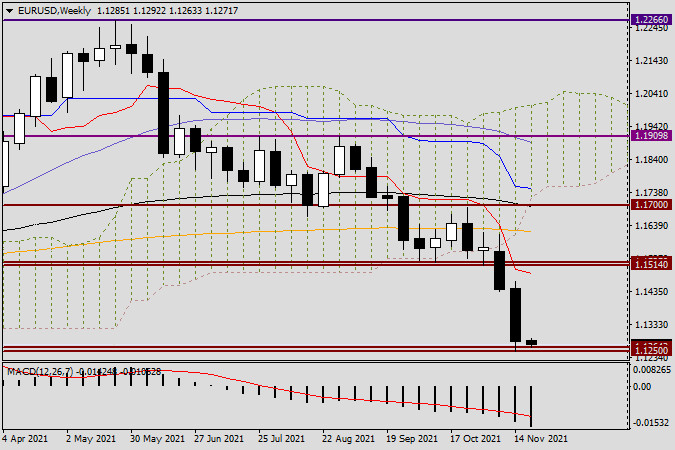
Following the results of trading sessions on November 15-19, a long bearish candlestick appeared on the weekly chart with a closing price below the important level of 1.1300. Previously, market participants were sure that the euro would be able to withhold bearish pressure. Yet, it did not happen. However, it is too early to make any conclusions about the trend after the breakout of one candlestick below the trend line. during this week, the euro should either confirm or cancel the breakout of a significant level of 1.1300. According to the Fibonacci Grid, stretched for a decline of 1.2266-1.1250, we can see that the first Fibo retracement level of 23.6 is located at 1.1490. It is quite far from the level where the euro/dollar is currently trading. At the same time, I would not completely rule out a corrective rollback or its attempts. Bulls may try to push the pair above the 1.1300 level. The question is whether they will succeed or not. Judging by the technical indicators on a weekly chart, the downward movement is likely to persist. If so, then the target level will be 1.1200. Now, let's look at a smaller timeframe.
Daily
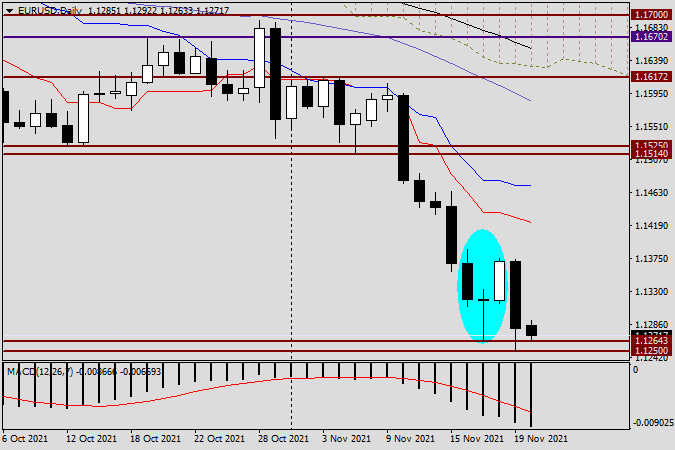
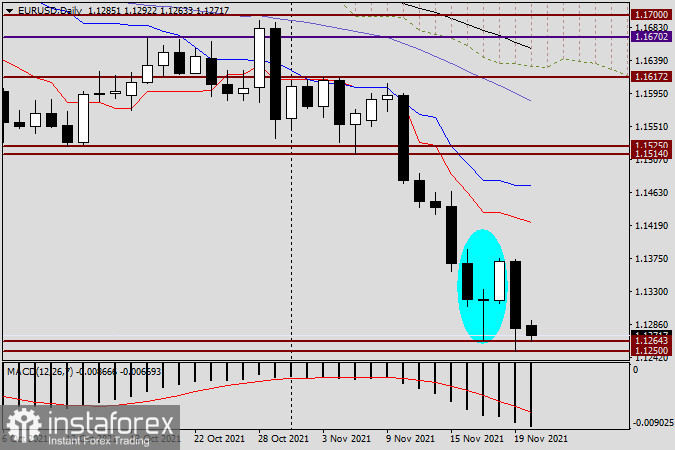
On this chart, we can see that last Friday, market participants ignored the reversal pattern - the Morning Star candlestick. In the previous review of the euro/dollar pair, this pattern was taken into account. Despite the clear picture of this pattern on the chart and the formation of a candlestick, it is against the current rather strong bearish trend. However, the final signal on the Morning Star reversal pattern will appear only after the breakout of 1.1264. At this level, there was the lower shadow of the Doji candlestick. In combination with two other candlesticks, it forms is the Morning Star pattern. The actual breakout of the 1.1264-1.1250 support zone creates good entry points to open short positions after a rollback to this price zone. Another option for opening short positions will be an unsuccessful attempt by bulls to push the pair above 1.1300 as well as the formation of a candlestick with a long upper shadow below this level. That's all for today. In tomorrow's article on EUR/USD, we will look at smaller charts and try to find more entry points.
Good luck!