What is needed to open long positions on EUR/USD
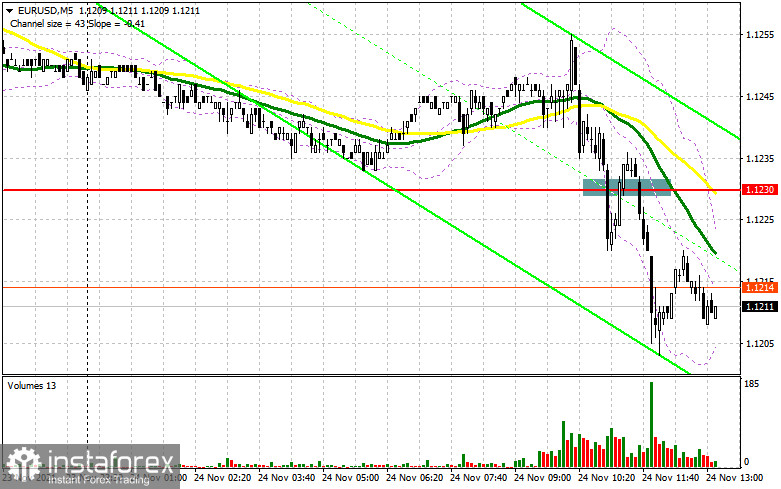
EUR failed to settle at intraday highs in light of a downbeat survey by IFO. The report logged a decline of all indicators, including a business climate index and economic expectations index for Germany. Now let's look at a 5-minute chart and try to figure out what happened earlier today. A breakout and a reverse test of 1.1230 upwards generated an excellent signal to open short positions. Later on, the currency pair sank more than 25 pips. At the moment of writing the article, EUR was at about intraday highs in anticipation of fundamental data from the US. The technical picture has changed a bit.
In the second half of the day, the US is due to released GDP data for Q3 2021 and the minutes of the last FPMC policy meeting. Solid data on the US economic growth is likely to reinforce demand for USD. Besides, the hawkish rhetoric in the FOMC minutes will push EUR/USD to lower lows. The euro bulls have to protect the nearest support of 1.1182.
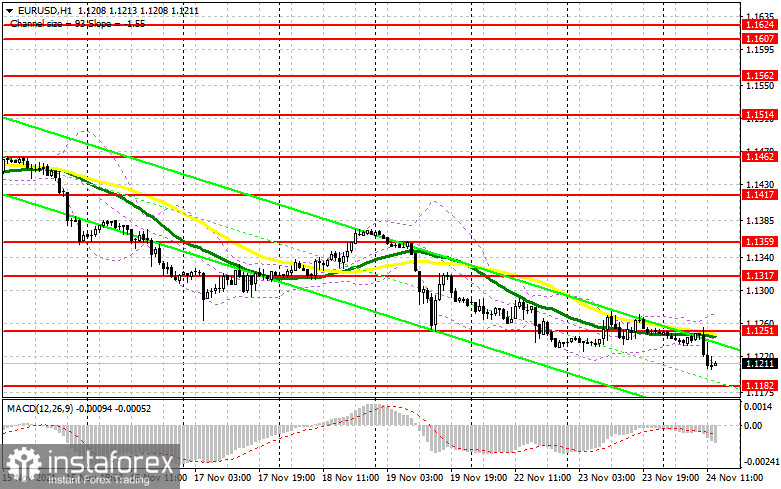
Only a fake breakout there will trigger the first market entry point against the downtrend that is going on this week. The main target will be resistance at 1.1251 that emerged in the first half of the trading week. This is the level where moving averages are passing that cap the upside potential. So, a breakout in this area will be the major task for the bulls. A test of 1.1251 downwards will give an excellent market entry point with the target at 1.1317 and a further update of 1.1359 where I recommend profit taking.
In case of the alternative bearish scenario, EUR/USD may decline to 1.1182 on condition of strong macroeconomic data from the US and the lack of bullish activity at this level. Thus, you would better to be cautious with buying the pair. I would recommend waiting until EUR/USD drops and makes a fake breakout at the lower low of 1.1106. You may open long positions on EUR/USD immediately at a bounce from 1.1034 and even lower from 1.0994, bearing in mind a 15-20-pips intraday correction.
What is needed to open short positions on EUR/USD
Meanwhile, the bears are holding the upper hand over EUR/USD, taking advantage of poor fundamental data on the Eurozone. The sell signal generated in the morning has worked well by the moment of writing this article. However, I would advise opening new short positions only after a fake breakout at resistance of 1.1251. This is the level where moving averages are passing, restricting the bullish momentum. With this scenario, the next bears' aim will be a breakout and consolidation below 1.1182. Upbeat data from the US could escalate pressure on EUR/USD. A breakout and a reverse test downwards will generate a new sell signal. So, the pair is facing sell-offs towards 1.1106. A more distant target is seen at support of 1.1034 where I recommend profit taking. In case the euro grows and the bears lack activity at 1.1251, it would be better to refrain from selling. The reasonable scenario will be opening short positions during a fake breakout at about 1.1317. Short positions could be opened immediately at a drop off highs at 1.1359 and 1.1417, bearing in mind a 15-20 pips downward correction.
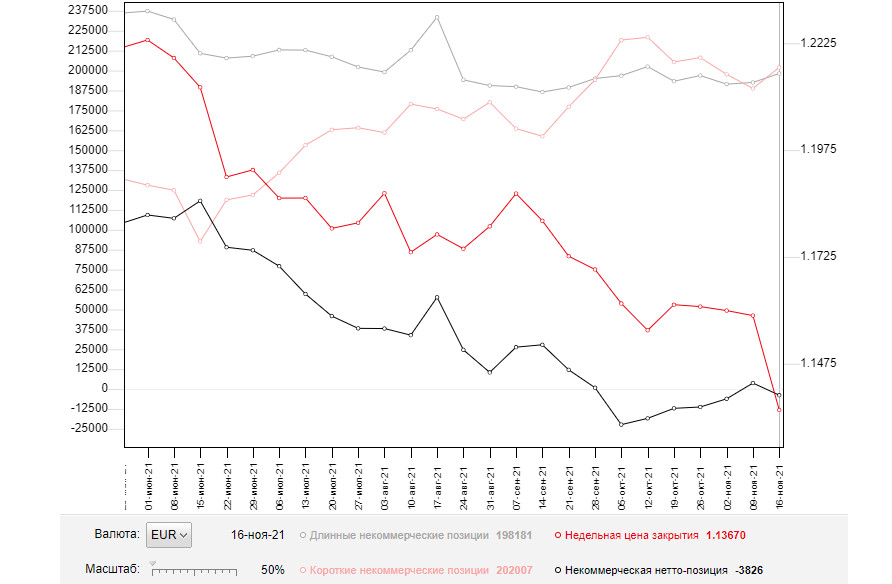
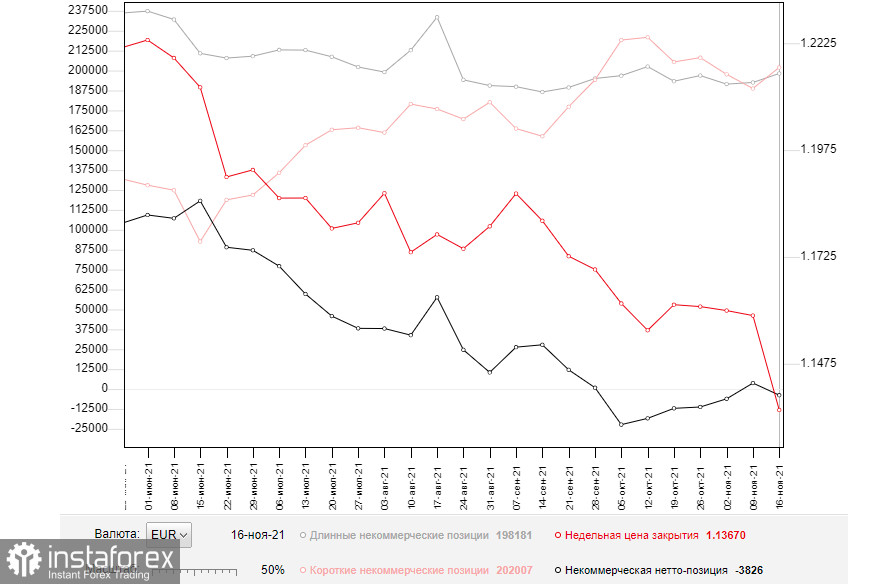
According to the COT report from November 16, we see increase of both short and long positions. The thing is that short positions prevailed that revived a negative delta. Though it is hovering in a narrow range at around zero for a long while, it is of little help to the euro buyers. The risk of new COVID resurgence and a consequent lockdown in the EU countries is putting pressure on the euro. Besides, EUR was bruised by the ECB decision to maintain ultra-loose monetary policy despite inflationary pressure.
In fact, the ECB policymakers have taken the right course. Austria has already introduced nationwide lockdown and strict social distancing. Now the German authorities are thinking about tightening restrictions. This is a strong precursor of further EUR weakness versus USD.
Meanwhile, the fact of soaring inflation in the US provides USD with solid support. A lot of investors are pricing in rate hikes by the US Fed earlier than initially expected, i.e. in mid-2022. Hence, they are betting on USD strength. In the last COT report, long non-commercial positions increased from 192,544 to 198,181. At the same time, short non-commercial positions also surged from 188,771 to 202,007. Closing last week, the overall non-commercial net positions again turned negative and came in at -3,826 against 3,773. EUR/USD closed last week at 1.1367, much lower than 1.1587 a week ago.
Signals of technical indicators
Moving averages
EUR/USD is trading slightly below 30- and 50-period moving averages that means a possible EUR slide in the second half of the trading day.
Remark. The author is analyzing a period and prices of moving averages on the 1-hour chart. So, it differs from the common definition of classic daily moving averages on the daily chart.
Bollinger Bands
A breakout of the upper border at about 1.1270 will encourage EUR growth. Alternatively, a breakout of the lower border at about 1.1210 will escalate pressure on EUR/USD.
Definitions of technical indicators
- Moving average recognizes an ongoing trend through leveling out volatility and market noise. A 50-period moving average is plotted yellow on the chart.
- Moving average identifies an ongoing trend through leveling out volatility and market noise. A 30-period moving average is displayed as the green line.
- MACD indicator represents a relationship between two moving averages that is a ratio of Moving Average Convergence/Divergence. The MACD is calculated by subtracting the 26-period Exponential Moving Average (EMA) from the 12-period EMA. A 9-day EMA of the MACD called the "signal line".
- Bollinger Bands is a momentum indicator. The upper and lower bands are typically 2 standard deviations +/- from a 20-day simple moving average.
- Non-commercial traders - speculators such as retail traders, hedge funds and large institutions who use the futures market for speculative purposes and meet certain requirements.
- Non-commercial long positions represent the total long open position of non-commercial traders.
- Non-commercial short positions represent the total short open position of non-commercial traders.
- The overall non-commercial net position balance is the difference between short and long positions of non-commercial traders.