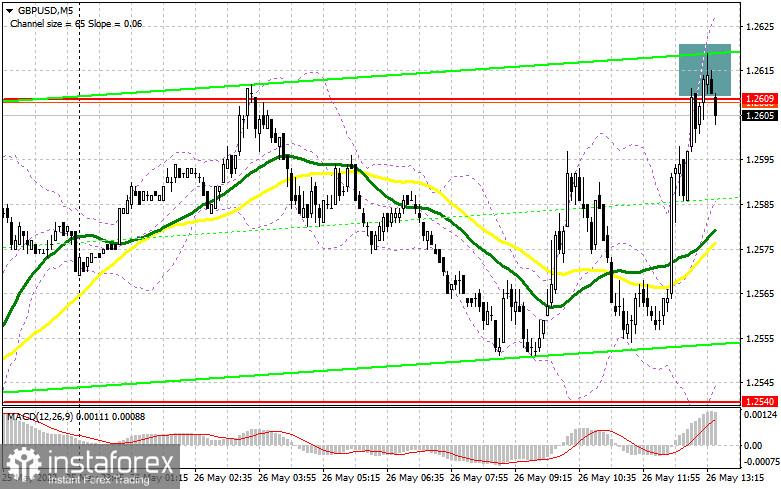
In my morning review, I mentioned the level of 1.2609 and recommended it as a good entry point. Let's look at the 5-minute chart and figure out where and how we should have entered the market. A rise in the quote and a false breakout of 1.2609 were quite expected amid the lack of any important fundamental background. This resulted in a good sell signal. However, the pair has not developed a strong downtrend yet. The fact that bears are so slow at this stage is already a worrisome sign. So, don't forget to place stop-loss orders as this trade is against the trend.
For long positions on GBP/USD:
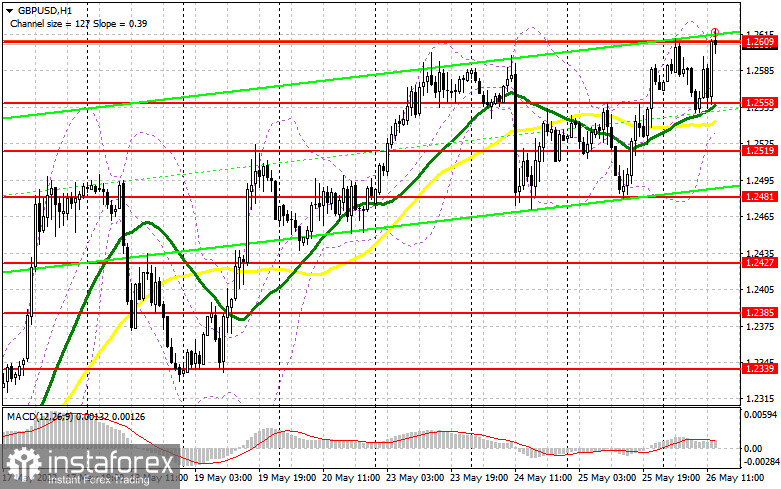
Bulls are poised to continue their rally and are ready to break through 1.2609. Today's macroeconomic data from the US may support the buyers. On Thursday, the US will release the report on GDP for the first quarter, weekly data on the labor market, and pending home sales. Upbeat results will help activate the morning sell signal, so GBP/USD may return to the new support area of 1.2558. This is where the moving averages supporting the bullish trend are located. A false breakout at this level will form a signal to open long positions in accordance with the current bull market and the upward target at the resistance of 1.2609. If sellers lose momentum at 1.2609, we can bet on another spike in the pair. However, only consolidation above 1.2609 with a retest of this level will trigger stop-loss orders set by the sellers and prompt the rise in GBP/USD to 1.2652. From there, the quote may head for the 1.2706 level, where I recommend taking profit. The area of 1.2765 will serve as a more distant target. If the pound declines and the buyers' activity is low at 1.2558, bulls may lose ground and the pound/dollar pair will come under pressure. The macroeconomic data below market expectations or some pessimistic comments from the UK policymakers can make things worse. Therefore, I advise you to wait with buying the pair. It is better to enter the market after a false breakout at 1.2519. You can buy GBP/USD immediately on a rebound from 1.2481 - the key weekly support level - or even lower from 1.2427, considering a possible correction of 30-35 pips within the day.
For short positions on GBP/USD:
Given that bears have lost momentum after a false breakout at 1.2609, I think that the pound will continue to rise and a good buy signal will appear at the level of 1.2609. However, as long as the pair is trading below the weekly high, we can expect the activation of the sell signal received in the morning. The publication of the US macroeconomic data may trigger another false breakout at 1.2609, which will help sellers assert strength and form a downward correction to the new support area of 1.2558. A breakout and a retest of this range will form an additional signal to open short positions. This will quickly bring the pound back to the 1.2519 area, paving the way towards 1.2481, where I recommend taking profit. A more distant target is found at 1.2427. Upon reaching this level, the uptrend will be canceled. However, this scenario is very unlikely without positive fundamental data from the US. If GBP/USD advances and trading activity declines at 1.2609, bears may again lose their grip which may send the pound sharply higher. In this case, I advise you to postpone short positions until the price reaches next major resistance at 1.2652. Short positions should be opened only in case of a false breakout. You can sell GBP/USD immediately on a rebound from the high of 1.2706, considering a possible pullback of 30-35 pips within a day.
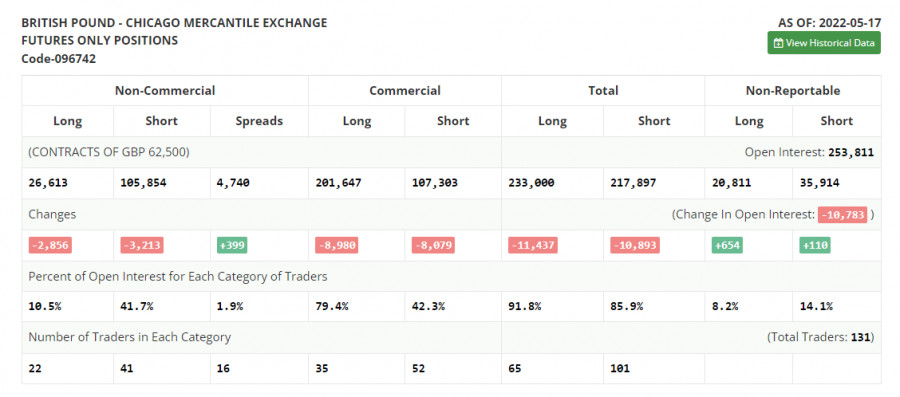
COT report
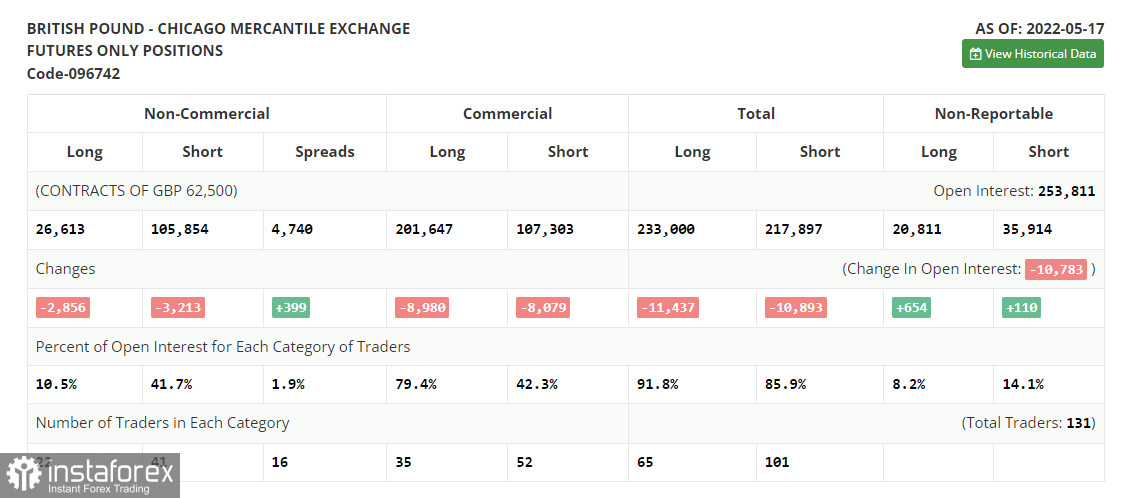
The COT report (Commitment of Traders) for May 17 revealed a reduction in both long and short positions, with the latter declining the most. This suggests that the market may be gradually approaching the bottom. Traders are probably enjoying attractive prices and showing their interest in the pair despite current uncertainty in the UK. I have repeatedly noted that such challenges for the UK economy as record-high inflation and a slowdown in economic growth pose a dilemma for the Bank of England. Yet, the Governor of the Bank of England, Andrew Bailey, said in his recent interview that the regulator was still planning to raise rates in the near future. On the other hand, the US Federal Reserve may change its mind. There are speculations that the US central bank plans to put its tightening cycle on hold in September this year, which will definitely weaken the US dollar. The COT report for May 17 indicates that long non-commercial positions fell by -2,856 to 26,613, while short non-commercial positions went down by -3,213 to 105,854. As a result, the total non-commercial net position decreased to -79 241 from - 79 598. The weekly closing price went higher to 1.2481 from 1.2313.
Indicator signals:
Moving Averages
Trading above the 30 and 50-day moving averages indicates that bulls are actively pushing the pound upwards.
Please note that the time period and levels of the moving averages are analyzed only for the H1 chart, which differs from the general definition of the classic daily moving averages on the D1 chart.
Bollinger Bands
In case of an uptrend, the middle line of the indicator at 1.2609 will act as resistance.
Description of indicators: • A moving average indicates the current trend by smoothing volatility and noise. 50-day period; marked in yellow on the chart;
• A moving average indicates the current trend by smoothing volatility and noise. 30-day period; marked in green on the chart;
• MACD Indicator (Moving Average Convergence/Divergence) Fast EMA, 12-day period; Slow EMA, 26-day period. SMA with a 9-day period;
• Bollinger Bands: 20-day period;
• Non-commercial traders are speculators such as individual traders, hedge funds, and large institutions who use the futures market for speculative purposes and meet certain requirements;
• Long non-commercial positions represent the total number of long positions opened by non-commercial traders;
• Short non-commercial positions represent the total number of short positions opened by non-commercial traders;
• The total non-commercial net position is the difference between short and long positions of non-commercial traders.