empty
 
 
29.11.2022 04:29 PM
EUR/USD. Analysis for November 29. The euro still has a chance to develop a downward wave.

This image is no longer relevant

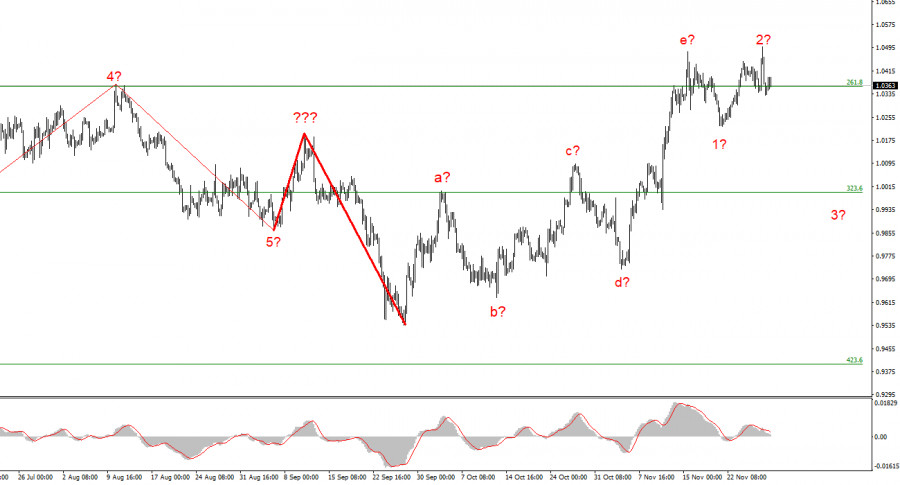
Although it still looks very convincing, the wave marking on the 4-hour chart for the euro/dollar instrument needs to be adjusted. The upward portion of the trend has corrected itself. A-b-c-d-e waves have a complex correction structure that we have discovered. Since the peak of wave e exceeds the peak of wave C, if the current wave layout is accurate, construction on this structure may be nearly finished or already be finished. In this instance, it is anticipated that we will construct at least three waves downward, but if the most recent phase of the trend was corrective, the subsequent phase will probably be impulsive. I am therefore getting ready for a new, significant decline in the instrument. The market will be ready to sell when a new attempt to breach the 1.0359 level, which corresponds to 261.8% Fibonacci, is successful. The wave e may end up being longer overall, and the instrument's most recent decline is not the first wave of a new descending section, as evidenced by the quotes' withdrawal from the lows reached last week and on Monday. The alleged waves 2 or b, however, might still exist because they only punctured wave e's peak. Because there isn't an increase in demand for US currency, the wave pattern is generally starting to become muddled.

There are intriguing performances, but there are still no reports.

The new week got off to a very active start for the euro/dollar instrument. The movements on Monday had a very high amplitude, but the instrument was unable to reach an upward potential at this time, so the wave marking is still intact. Representatives of the ECB and the Fed have recently provided a variety of information. I can't say that all of this information contradicts one another, but the market is currently nervous and lacks a clear plan for what to do next. Recall that the current wave markup appears almost entirely clear and calls for the creation of a downward wave. But this wave cannot be built if the demand for US currency does not rise.

Yesterday afternoon, the St. Louis Federal Reserve's president, James Bullard, delivered a speech. Bullard is regarded as one of the toughest "hawks," and his rhetoric frequently raises interest in US currency. Exactly that is what we might have witnessed yesterday. Bullard predicted that once the rate exceeds 5%, it will remain extremely high throughout 2023 and a portion of 2024. He thinks that the market continues to undervalue the full impact of high inflation and the necessity for long-term tight monetary policy. Bullard emphasized that "inflation will not slow down by itself." Additionally, the rate increase in December was not discussed by the president of the St. Louis Federal Reserve. Everyone agrees that the Fed will increase interest rates by 50 basis points at its next meeting, but Bullard could have been counted on to support a 75-point increase. Regardless, his rhetoric was in favor of the US dollar, but it now needs to build on this success.

This image is no longer relevant

Conclusions in general

I conclude that the upward trend section's construction is complete and has increased in complexity to five waves (or is nearing its completion). As a result, I suggest making sales with targets close to the estimated 0.9994 level, or 323.6% Fibonacci. There is a chance that the upward section of the trend will become more complicated and take on an extended form, but this chance is currently no greater than 10%.

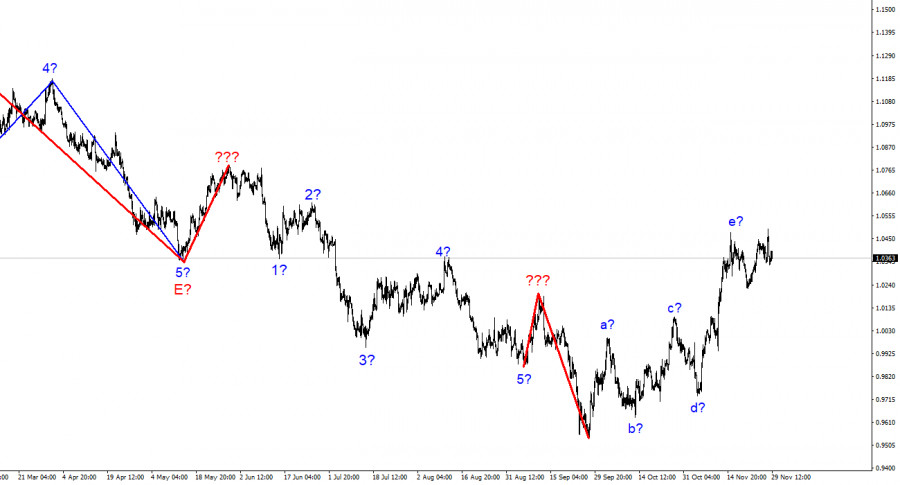
The wave marking of the descending trend segment noticeably becomes more intricate and lengthens at the higher wave scale. The a-b-c-d-e structure is most likely represented by the five upward waves we observed. After the construction of this section is finished, work on a downward trend section may resume.

Chin Zhao,
Analytical expert of InstaForex
© 2007-2023
EURUSD
Euro vs US Dollar
Select timeframe
5
min
15
min
30
min
1
hour
4
hours
1
day
1
week
Start trade
Start trade
  • Grand Choice
    Contest by
    InstaForex
    InstaForex always strives to help you
    fulfill your biggest dreams.
    JOIN CONTEST
  • Chancy Deposit
    Deposit your account with $3,000 and get $1000 more!
    In April we raffle $1000 within the Chancy Deposit campaign!
    Get a chance to win by depositing $3,000 to a trading account. Having fulfilled this condition, you become a campaign participant.
    JOIN CONTEST
  • Trade Wise, Win Device
    Top up your account with at least $500, sign up for the contest, and get a chance to win mobile devices.
    JOIN CONTEST
  • 100% Bonus
    Your unique opportunity to get a 100% bonus on your deposit
    GET BONUS
  • 55% Bonus
    Apply for a 55% bonus on your every deposit
    GET BONUS
  • 30% Bonus
    Receive a 30% bonus every time you top up your account
    GET BONUS

Recommended Stories

EUR/USD. Analysis for March 31, 2023

The last upward wave has caused more confusion with the wave analysis on the 4-hour chart for the euro/dollar pair. Given that the previous descending segment can be viewed

Chin Zhao 18:33 2023-03-31 UTC+2

Elliott wave analysis of UNG for March 31, 2023

Our proxy for Natural Gas, UNG, is in the very final stages for the decline from 34.50. We think that a final spike to just below 6.58 could be seen

Torben Melsted 06:13 2023-03-31 UTC+2

Elliott wave analysis of EUR/USD for March 31, 2023

EUR/USD is challenging resistance at 1.0930. A break above here will open the door for a higher move towards resistance at 1.1033 on the way higher to the first upside

Torben Melsted 06:09 2023-03-31 UTC+2

GBP/USD. Analysis for March 30, 2023

The wave analysis for the pound/dollar pair now appears challenging, but it does not call for any clarifications. There are some differences between the wave patterns of the euro

Chin Zhao 16:44 2023-03-30 UTC+2

EUR/USD. Analysis for March 30. The euro continues to build an upward set of waves

The last upward wave has caused more confusion with the wave analysis on the 4-hour chart for the euro/dollar pair. Given that the previous descending segment can be viewed

Chin Zhao 16:12 2023-03-30 UTC+2

Elliott wave analysis of EUR/JPY for March 30, 2023

The long-term picture of EUR/JPY shows that a multi-year triangle completed with the test of 114.20 in May 2020 and a new impulsive rally was initiated. This rally has much

Torben Melsted 07:45 2023-03-30 UTC+2

Elliott wave analysis of USD/JPY for March 30, 2023

Today we will take a view of the long-term picture of USD/JPY. After the peak in October 2022 at 151.94, we have seen wave A move lower to test support

Torben Melsted 07:37 2023-03-30 UTC+2

GBP/USD. Analysis for March 29. The pound continues to form an unclear wave

The wave analysis for the pound/dollar pair now appears challenging, but it does not call for any clarifications. There are some distinctions between the wave patterns of the euro

Chin Zhao 17:51 2023-03-29 UTC+2

EUR/USD. Analysis for March 29. The market is waiting for a new acceleration of core inflation in the European Union.

The final upward wave continues to confuse the wave pattern on the 4-hour chart for the euro/dollar pair. Since the previous downward trend segment can be viewed as a three-wave

Chin Zhao 17:31 2023-03-29 UTC+2

Elliott wave analysis of EUR/USD for March 29, 2023

EUR/USD has rallied nicely of the 50% corrective target at 1.0723 and is currently testing short-term important resistance at 1.0840. A clear break above here will confirm that the correction

Torben Melsted 07:39 2023-03-29 UTC+2
现在无法通话?
提出您的问题,用 在线帮助.