empty
 
 
29.11.2022 04:29 PM
EUR/USD. Analysis for November 29. The euro still has a chance to develop a downward wave.

This image is no longer relevant

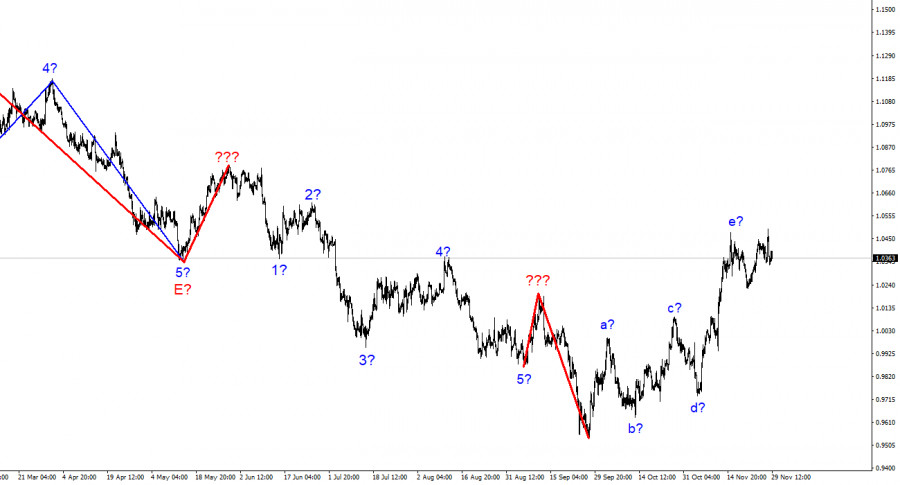
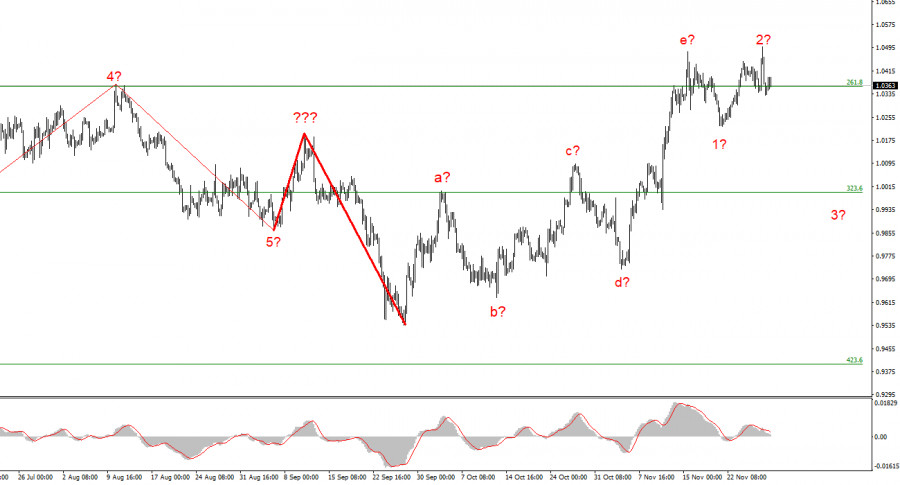
Although it still looks very convincing, the wave marking on the 4-hour chart for the euro/dollar instrument needs to be adjusted. The upward portion of the trend has corrected itself. A-b-c-d-e waves have a complex correction structure that we have discovered. Since the peak of wave e exceeds the peak of wave C, if the current wave layout is accurate, construction on this structure may be nearly finished or already be finished. In this instance, it is anticipated that we will construct at least three waves downward, but if the most recent phase of the trend was corrective, the subsequent phase will probably be impulsive. I am therefore getting ready for a new, significant decline in the instrument. The market will be ready to sell when a new attempt to breach the 1.0359 level, which corresponds to 261.8% Fibonacci, is successful. The wave e may end up being longer overall, and the instrument's most recent decline is not the first wave of a new descending section, as evidenced by the quotes' withdrawal from the lows reached last week and on Monday. The alleged waves 2 or b, however, might still exist because they only punctured wave e's peak. Because there isn't an increase in demand for US currency, the wave pattern is generally starting to become muddled.

There are intriguing performances, but there are still no reports.

The new week got off to a very active start for the euro/dollar instrument. The movements on Monday had a very high amplitude, but the instrument was unable to reach an upward potential at this time, so the wave marking is still intact. Representatives of the ECB and the Fed have recently provided a variety of information. I can't say that all of this information contradicts one another, but the market is currently nervous and lacks a clear plan for what to do next. Recall that the current wave markup appears almost entirely clear and calls for the creation of a downward wave. But this wave cannot be built if the demand for US currency does not rise.

Yesterday afternoon, the St. Louis Federal Reserve's president, James Bullard, delivered a speech. Bullard is regarded as one of the toughest "hawks," and his rhetoric frequently raises interest in US currency. Exactly that is what we might have witnessed yesterday. Bullard predicted that once the rate exceeds 5%, it will remain extremely high throughout 2023 and a portion of 2024. He thinks that the market continues to undervalue the full impact of high inflation and the necessity for long-term tight monetary policy. Bullard emphasized that "inflation will not slow down by itself." Additionally, the rate increase in December was not discussed by the president of the St. Louis Federal Reserve. Everyone agrees that the Fed will increase interest rates by 50 basis points at its next meeting, but Bullard could have been counted on to support a 75-point increase. Regardless, his rhetoric was in favor of the US dollar, but it now needs to build on this success.

This image is no longer relevant

Conclusions in general

I conclude that the upward trend section's construction is complete and has increased in complexity to five waves (or is nearing its completion). As a result, I suggest making sales with targets close to the estimated 0.9994 level, or 323.6% Fibonacci. There is a chance that the upward section of the trend will become more complicated and take on an extended form, but this chance is currently no greater than 10%.

The wave marking of the descending trend segment noticeably becomes more intricate and lengthens at the higher wave scale. The a-b-c-d-e structure is most likely represented by the five upward waves we observed. After the construction of this section is finished, work on a downward trend section may resume.

Chin Zhao,
الخبير التحليلي لدى شركة إنستافوركس
© 2007-2023
EURUSD
Euro vs US Dollar
Select timeframe
5
min
15
min
30
min
1
hour
4
hours
1
day
1
week
Start trade
Start trade
  • Grand Choice
    Contest by
    InstaForex
    InstaForex always strives to help you
    fulfill your biggest dreams.
    انضم إلى المسابقة
  • إيداع الحظ
    قم بإيداع 3,000 دولار في حسابك واحصل على $5,000 وأكثر من ذالك!
    في مارس نحن نقدم باليانصيب $5,000 ضمن حملة إيداع الحظ!
    احصل على فرصة للفوز من خلال إيداع 3,000 دولار في حساب تداول. بعد أن استوفيت هذا الشرط، تصبح مشاركًا في الحملة.
    انضم إلى المسابقة
  • تداول بحكمة، اربح جهازا
    قم بتعبئة حسابك بمبلغ لا يقل عن 500 دولار ، واشترك في المسابقة ، واحصل على فرصة للفوز بأجهزة الجوال.
    انضم إلى المسابقة
  • بونص 100٪
    فرصتك الفريدة للحصول على بونص 100٪ على إيداعك
    احصل على بونص
  • بونص 55٪
    تقدم بطلب للحصول على بونص 55٪ على كل إيداع
    احصل على بونص
  • بونص 30٪
    احصل على بونص 30٪ في كل مرة تقوم فيها بتعبئة حسابك
    احصل على بونص

Recommended Stories

تحليل موجات اليوت لزوج اليورو دولار ليوم 25 يوليو 2022.

كسر زوج يورو / دولار ما دون الدعم عند 1.0153 والذي أخبرنا أن الموجة 1 قد اكتملت باختبار 1.0269 وأن التراجع التصحيحي / التماسك في الموجة الثانية كان يتكشف

Torben Melsted 23:42 2022-07-25 UTC+2

تحليل موجات اليوت لزوج اليورو ين ليوم 25 يوليو 2022.

دعونا نعود خطوة إلى الوراء ونلقي نظرة على الصورة الأكبر اليوم. اخترق زوج اليورو / الين الياباني فوق خط مقاومة المثلث مرة أخرى في ديسمبر 2020 مؤكداً اكتمال تشكيل المثلث

Torben Melsted 23:38 2022-07-25 UTC+2

تحليل موجات إليوت لزوج اليورو / الين الياباني ليوم 1 يونيو 2022

ما زلنا نبحث عن مزيد من الضغط الهبوطي حيث من المفترض أن يستمر التصحيح من 140.04 لفترة أطول. ومع ذلك ، فإن الارتفاع الحالي من 132.66 يمكن أن يبلغ ذروته

Torben Melsted 08:52 2022-06-01 UTC+2

تحليل موجات إليوت للذهب ليوم 20 مايو 2022

انخفض الذهب إلى منطقة الدعم بين 1,751 - 1,824 وكان من الممكن أن يكمل التصحيح في الموجة (2) ويبدأ الارتفاع المندفع التالي نحو أعلى مستوى على الإطلاق عند 2,070 لمواصلة

Torben Melsted 14:19 2022-05-20 UTC+2

تحليل موجات إليوت للفضة ليوم 20 مايو 2022

تُظهر الفضة إشارات متزايدة أقوى على الوصول إلى القاع للارتفاع المندفع التالي نحو المقاومة عند 30.00 وفي النهاية الصعود نحو أعلى مستوى على الإطلاق عند 50.00. سيؤكد الاختراق الواضح

Torben Melsted 13:23 2022-05-20 UTC+2

التحليل الفني لزوج الباوند دولار ليوم 11 يناير 2022.

يستمر زوج استرليني / دولار في التحرك صعودًا من المستوى 1.3507. وفقًا للأحداث السابقة ، لا يزال زوج استرليني / دولار يتحرك بين مستويي 1.3507 و 1.3680 ؛ لذلك نتوقع

Mourad El Keddani 20:10 2022-01-11 UTC+2

تحليل موجات إليوت لزوج اليورو دولار.

ارتفع معدل تقلب اليورو مقابل الدولار الأميركي يوم أمس حيث تسبب السعر في تقلبات هائلة. حيث وبينما كان التداول بالقرب من 1.14 انعكس السعر بقوة وانخفض إلى أدنى مستوى

Alexandros Yfantis 17:23 2021-12-01 UTC+2

خطة التداول لزوج اليورو دولار ليوم 6 اكتوبر 2021.

لا يزال اليورو مقابل الدولار الأميركي يصحح هبوطيًا بعد أن وصل إلى مستوى 1.1640 يوم الاثنين. حيث انخفض الزوج إلى 1.1580 يوم الثلاثاء كما هو متوقع. ويتواجد أيضًا بالقرب

Oscar Ton 20:37 2021-10-06 UTC+2

تحليل المؤشر. المراجعة اليومية لزوج اليورو/الدولار الأمريكي ليوم 11 يونيو 2021

بالأمس انخفض زوج اليورو/الدولار واختبر دعم خط الاتجاه الصاعد - 1.2143 (الخط الأزرق الغامق). وبعد ذلك ارتفع السعر. أغلق السوق الشمعة اليومية عند 1.2172 وقد يستمر في التحرك صعودًا

Stefan Doll 12:12 2021-06-11 UTC+2

تحليل موجات إليوت لزوج اليورو/الين الياباني ليوم 17 مايو 2021

زوج اليورو/الين الياباني هو في المرحلة الأخيرة من الصعود إلى الهدف 133.66 من حيث يجب أن نتوقع حدوث تصحيح في الموجة 4/ نحو مستوى 130.82 على الأقل وربما إلى الهدف

Torben Melsted 12:19 2021-05-17 UTC+2
لا تستطيع التحدث الآن؟
اطرح سؤالك في الدردشة.