empty
 
 
29.11.2022 04:29 PM
EUR/USD. Analysis for November 29. The euro still has a chance to develop a downward wave.

This image is no longer relevant

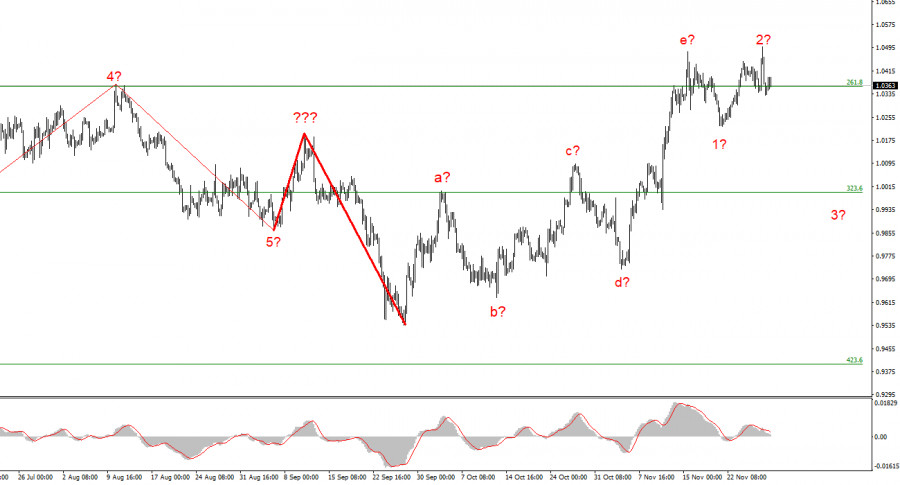
Although it still looks very convincing, the wave marking on the 4-hour chart for the euro/dollar instrument needs to be adjusted. The upward portion of the trend has corrected itself. A-b-c-d-e waves have a complex correction structure that we have discovered. Since the peak of wave e exceeds the peak of wave C, if the current wave layout is accurate, construction on this structure may be nearly finished or already be finished. In this instance, it is anticipated that we will construct at least three waves downward, but if the most recent phase of the trend was corrective, the subsequent phase will probably be impulsive. I am therefore getting ready for a new, significant decline in the instrument. The market will be ready to sell when a new attempt to breach the 1.0359 level, which corresponds to 261.8% Fibonacci, is successful. The wave e may end up being longer overall, and the instrument's most recent decline is not the first wave of a new descending section, as evidenced by the quotes' withdrawal from the lows reached last week and on Monday. The alleged waves 2 or b, however, might still exist because they only punctured wave e's peak. Because there isn't an increase in demand for US currency, the wave pattern is generally starting to become muddled.

There are intriguing performances, but there are still no reports.

The new week got off to a very active start for the euro/dollar instrument. The movements on Monday had a very high amplitude, but the instrument was unable to reach an upward potential at this time, so the wave marking is still intact. Representatives of the ECB and the Fed have recently provided a variety of information. I can't say that all of this information contradicts one another, but the market is currently nervous and lacks a clear plan for what to do next. Recall that the current wave markup appears almost entirely clear and calls for the creation of a downward wave. But this wave cannot be built if the demand for US currency does not rise.

Yesterday afternoon, the St. Louis Federal Reserve's president, James Bullard, delivered a speech. Bullard is regarded as one of the toughest "hawks," and his rhetoric frequently raises interest in US currency. Exactly that is what we might have witnessed yesterday. Bullard predicted that once the rate exceeds 5%, it will remain extremely high throughout 2023 and a portion of 2024. He thinks that the market continues to undervalue the full impact of high inflation and the necessity for long-term tight monetary policy. Bullard emphasized that "inflation will not slow down by itself." Additionally, the rate increase in December was not discussed by the president of the St. Louis Federal Reserve. Everyone agrees that the Fed will increase interest rates by 50 basis points at its next meeting, but Bullard could have been counted on to support a 75-point increase. Regardless, his rhetoric was in favor of the US dollar, but it now needs to build on this success.

This image is no longer relevant

Conclusions in general

I conclude that the upward trend section's construction is complete and has increased in complexity to five waves (or is nearing its completion). As a result, I suggest making sales with targets close to the estimated 0.9994 level, or 323.6% Fibonacci. There is a chance that the upward section of the trend will become more complicated and take on an extended form, but this chance is currently no greater than 10%.

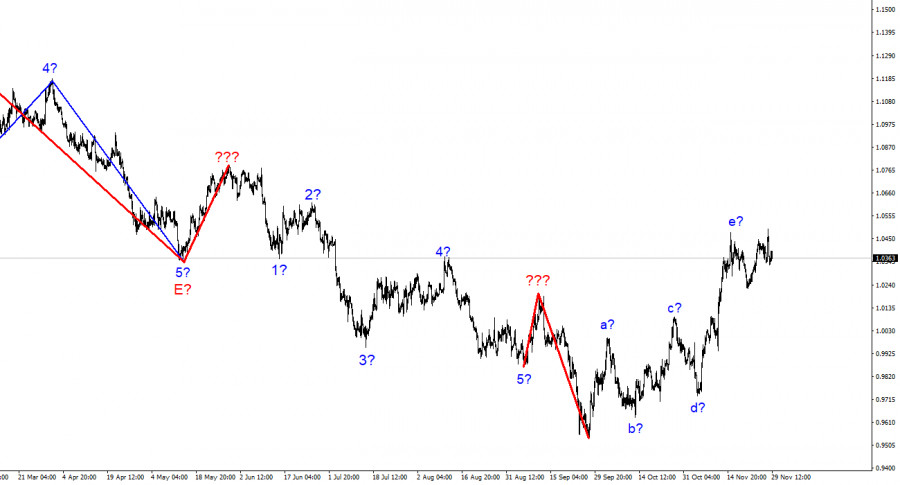
The wave marking of the descending trend segment noticeably becomes more intricate and lengthens at the higher wave scale. The a-b-c-d-e structure is most likely represented by the five upward waves we observed. After the construction of this section is finished, work on a downward trend section may resume.

EURUSD
Euro vs US Dollar
Select timeframe
5
min
15
min
30
min
1
hour
4
hours
1
day
1
week
Start trade
Start trade
  • Grand Choice
    Contest by
    InstaForex
    InstaForex always strives to help you
    fulfill your biggest dreams.
    UNIRSE AL CONCURSO
  • Depósito al azar
    ¡Haga un depósito en su cuenta de $3,000 y obtenga $8000 más!
    ¡En Marzo, sorteamos $8000 dentro de la campaña Depósito afortunado!
    Obtenga la oportunidad de ganar depositando $3,000 en una cuenta de operaciones. Tras haber cumplido esta condición, se convertirá en un participante de la campaña.
    UNIRSE AL CONCURSO
  • Opere de forma inteligente, gane un dispositivo
    Recargue su cuenta con al menos $500, regístrese en el concurso y tenga la oportunidad de ganar dispositivos móviles.
    UNIRSE AL CONCURSO
  • 100% de bonificación
    Su oportunidad única de obtener un bono del 100 % en su depósito
    OBTENER BONO
  • 55% de bonificación
    Solicite un bono del 55% en cada depósito
    OBTENER BONO
  • 30% de bonificación
    Reciba un bono del 30% cada vez que recargue su cuenta
    OBTENER BONO

Recommended Stories

Análisis del EUR/USD para el 23 de marzo. El dólar cayó como resultado de las acciones de Jerome Powell

El reciente aumento en el valor del euro ha causado cierta confusión en el análisis de ondas en el gráfico de 4 horas para el par euro/dólar. Vimos una disminución

Chin Zhao 18:28 2023-03-23 UTC+2

Análisis del EUR/USD para el 22 de marzo de 2023. El euro continúa su crecimiento

El reciente aumento en el valor del euro ha causado cierta confusión en la marca de onda en el gráfico de 4 horas para el par euro/dólar. Vimos una disminución

Chin Zhao 18:44 2023-03-22 UTC+2

Análisis del GBP/USD para el 16 de marzo de 2023

El análisis de onda para el par libra/dólar ahora parece ser un desafío, pero no requiere ninguna aclaración. Los patrones de onda para el euro y la libra difieren

Chin Zhao 19:05 2023-03-16 UTC+2

Análisis del GBP/USD para el 14 de marzo de 2023

El análisis de onda para el par libra/dólar ahora parece ser un desafío, pero no requiere ninguna aclaración. Los patrones de onda para el euro y la libra difieren

Chin Zhao 19:18 2023-03-14 UTC+2

Análisis del EUR/USD para el 13 de marzo de 2023

El gráfico de 4 horas para el par euro/dólar aún muestra el mismo patrón de onda, lo cual es excelente porque nos permite predecir cómo se desarrollará la situación. También

Chin Zhao 17:26 2023-03-13 UTC+2

Análisis del EUR/USD para el 10 de marzo de 2023

El gráfico de 4 horas para el par euro/dólar aún muestra el mismo patrón de onda, lo cual es excelente porque nos permite predecir cómo se desarrollará la situación. También

Chin Zhao 14:46 2023-03-10 UTC+2

Análisis del GBP/USD para el 10 de marzo de 2023

El análisis de onda para el par libra/dólar ahora parece ser un desafío, pero no requiere ninguna aclaración. Los patrones de onda para el euro y la libra difieren

Chin Zhao 13:56 2023-03-10 UTC+2

Análisis del GBP/USD para el 8 de marzo de 2023

El análisis de onda para el par libra/dólar ahora parece ser un desafío, pero no requiere ninguna aclaración. Los patrones de onda para el euro y la libra difieren

Chin Zhao 18:12 2023-03-08 UTC+2

Análisis del EUR/USD para el 7 de marzo de 2023

El patrón de onda en el gráfico de 4 horas para el par euro/dólar no ha cambiado en absoluto recientemente, lo cual es excelente porque significa que sabemos cómo podrían

Chin Zhao 21:11 2023-03-07 UTC+2

Análisis del EUR/USD para el 6 de marzo. El mercado no prestó atención a las estadísticas de la UE

El gráfico de 4 horas para el par euro/dólar aún muestra el mismo patrón de onda, lo cual es excelente porque nos permite predecir cómo se desarrollará la situación. Aunque

Chin Zhao 19:05 2023-03-06 UTC+2
¿No puede hablar ahora mismo?
Ingrese su pregunta en el chat.