From a complex analysis, we see that the quote failed to show activity during the past day, maintaining a kind of restraint set by the market earlier. Indecision to act remains on the market for the fourth day in a row after the quote approached the psychological level of 1.1000. The sharp decline in the activity and the compression of the quote led to the fact that market participants were trapped in uncertainty, where even the external background can not move the quote from the dead point. The most significant moment was the technical factor of the previous day, where the correlated GBPUSD pair managed to show high activity during its background - more than 100 points in the form of a pulse, and the EURUSD pair continued its sluggish wandering within the previously set limits. The lack of interaction between trading instruments in such a set of circumstances confirms the fact of pressure on market participants of sharp changes.
Having information about such strong pressure and the lack of a proper rebound from the psychological level of 1.1000, the recovery theory takes on a deeper meaning. So, the restraint of buyers, who had every chance to turn the quote in the right direction, remained without action, and sellers, due to the circumstances, build a platform within the second stage of recovery. As you know, this is a theory, but if you refer to a steady downward move and the fact that the oblong correction has been held in the market for at least four months, then there is still a common sense of recovery. Let me remind you that the stumbling block is the level of 1.1000, which displays the second stage. Until it is broken, the risk of continuing the oblong correction remains.
In terms of volatility, we see that since the beginning of the week, the average daily indicator is 30 points, which is 33% lower than the overall dynamics of the currency pair. See the table at the end of the article.
(Daily variation: 28 points - Monday; 27 points - Tuesday; 35 points - Wednesday; 33 points - Thursday)
Analyzing the past day by the minute, we see an upward trend and the development of which occurred within the control values.
As discussed in the previous review, traders are waiting for a break in the stagnation that has formed over the past days, where the points of interaction with trading positions are located in the coordinates of 1.0980 and 1.1040.
Looking at the trading chart in general terms (the daily period), we see a constant fluctuation within the oblong correction, where no drastic changes have yet occurred.
The news background of the previous day included data on the unemployment rate in Europe, where they recorded a decline from 7.5% to 7.4%, and the euro did not react in any way. In the second half of the day, data was released on applications for unemployment benefits in the United States, where changes were not expected, but they occurred. So, initial applications decreased by 7 thousand, but repeated ones decreased by 44 thousand. The market reaction was absent here, which is even more alarming for market participants.
Today, in terms of the economic calendar, we have already received data on the level of inflation in Europe. The forecasts coincided and we saw an acceleration from 1.3% to 1.4%. Even a moderate increase in inflation reduces the fear of a possible ECB interest rate cut. After that, preliminary data on EU GDP were released, where expectations coincided and we saw a slowdown from 1.2% to 1.0%. There was no market reaction, which continues to pump ambiguity into the existing fluctuation.
The upcoming trading week in terms of the economic calendar has PMI data, as well as a report from the United States Department of Labor, which will arouse the interest of market participants.
The most interesting events displayed below:
On Monday, February 3
EU 10:00 London time - business activity index in the manufacturing sector (PMI): Prev 47.8 -> Forecast 45.9
USA 15:00 London time - manufacturing PMI from ISM (Jan): Prev 47.2 -> Forecast 48.0
On Tuesday, February 4
UK 10:30 London time - index of business activity in the construction sector (Jan): Prev 44.4 -> Forecast 45.9
USA 16:00 London time - the volume of industrial orders
On Wednesday, February 5
EU 11:00 London time - Retail sales (y/y) (Dec): Prev 2.2% -> Forecast 1.3%
USA 14:15 London time - ADP report on private sector employment (Jan): Prev 202K -> Forecast 155K
USA 16:00 London time - ISM business activity index in the service sector (Jan)
On Friday, February 7
USA 14:30 London time - unemployment rate
USA 14:30 London time - report of the United States Department of Labor: Prev 145K -> Forecast 156K
Further development
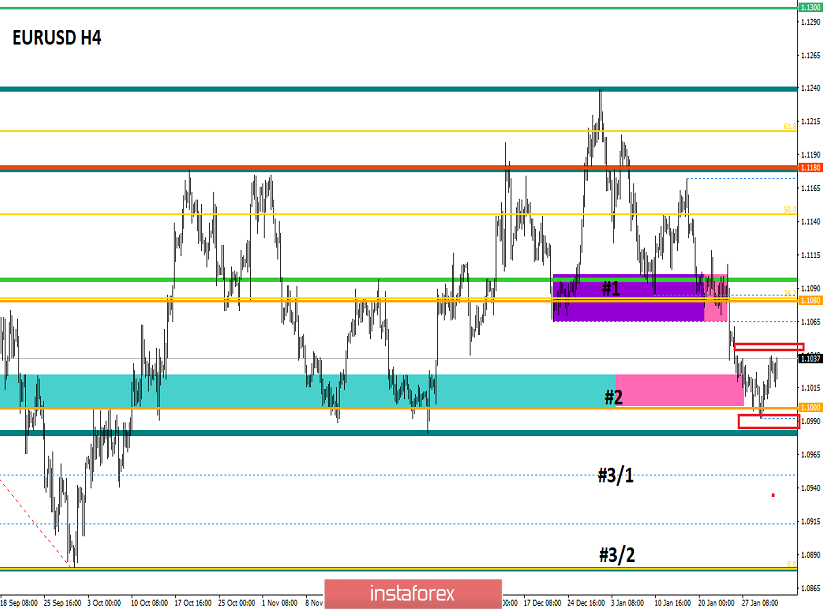
Analyzing the current trading chart, we see that the quote is conditionally in place, focusing on the area of 1.1020/1.1040. The process of stagnation persists in the market, and this is the fifth day. Market participants are closely monitoring the price-fixing points and its behavior, since such a long hovering within the psychological level of 1.1000 has not been for a long time. Concerning reducing volatility, as well as ignoring the external background, we can assume that acceleration is coming, and the direction is not so important, as the local jump on which you can earn.
In turn, traders are closely watching the coordinates of 1.0980 and 1.1040, as the jump in activity will come soon, as was the case for the GBPUSD pair.
It is likely to assume that the ambiguous mood will soon subside and a local discharge will occur, which may not lead to drastic changes, but it will be possible to make money on it, and in this case, this is the most important thing. The points of interaction with trading operations are located in the values of 1.0980 - sell and 1.1040 - buy.
Based on the above information, we will output trading recommendations:
- Buy positions will be considered in the event of a breakdown of the accumulation and fixing the price higher than 1.1040.
- Sell positions are considered if the downward interest is held and the price is fixed below 1.0980, without the shadow piercing the candle. The perspective of the move is located in the following stages: #3/1-1.0950 and #3/2-1.0879.
Indicator analysis
Analyzing different sectors of timeframes (TF), we see that due to the prolonged stagnation, the indicators of technical instruments at minute and hour intervals have become unstable. In turn, the medium-term outlook still signals sales.
Volatility for the week / Volatility Measurement: Month; Quarter; Year.
The volatility measurement reflects the average daily fluctuation, based on the calculation for the Month / Quarter / Year.
(January 31 was based on the time of publication of the article)
The volatility of the current time is 21 points, which is a low value even relative to the dynamics of the current week. It is likely to assume that if the price remains stagnant and fluctuates within the specified limits, we will not see any drastic changes in terms of volatility.
Key levels
Resistance zones: 1.1080**; 1.1180; 1.1300**; 1.1450; 1.1550; 1.1650*; 1.1720**; 1.1850**; 1.2100.
Support zones: 1.1000***; 1.0900/1.0950**;1.0850**; 1.0500***; 1.0350**; 1.0000***.
* Periodic level
** Range level
*** Psychological level
***** The article is based on the principle of conducting a transaction, with daily adjustments.