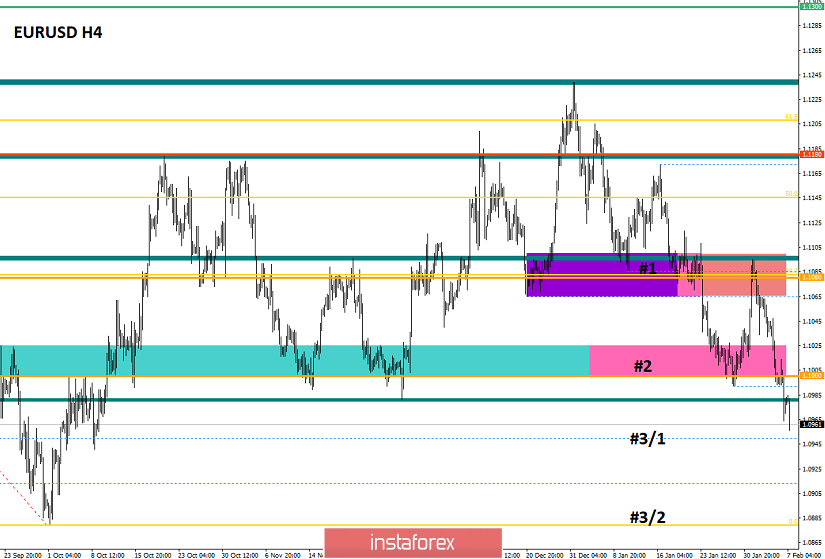
Using complex analysis, we observed one of the most long-awaited moments, which is the breakdown of the psychological level of 1,1000. For more than 80 trading days, market participants were stuck at the control level of 1.1000, where they dubbed it as the "stumbling block of bears". Now, there is a moment of glory, as the quote fixes at 1.0993 / 1.1005, where the polarity changes locally at the end of the trading force, and we see a local decline to the level of 1.0964. The most remarkable point was that the price fixing below 1.0980 occurred on the H4 period, which increases the chances of retention. Let me remind you that earlier, we noticed the formation of a downward movement in the first days of January, which was the longest stroke of a downward movement in the structure of the oblong correction.
Regarding the recovery process, we see that step number 2 is broken, and we are already at the 76% of the recovery. Because of this, the chances of reaching stages # 3/1 [1.0950] and # 3/2 [1.0880] is greater than ever.
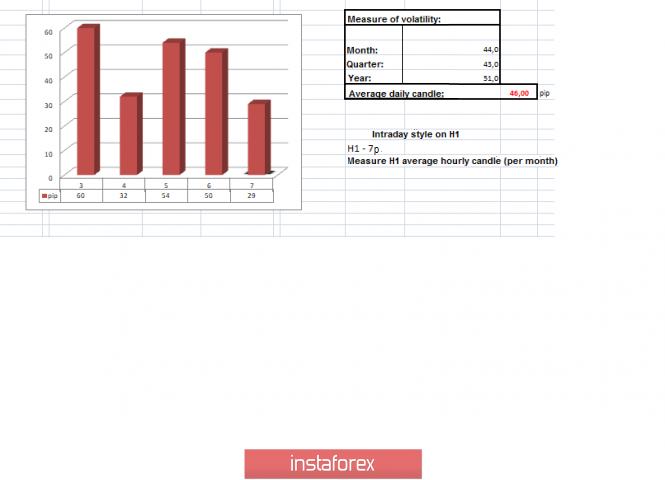
In terms of volatility, we see not so high indicators at the time of passing the psychological level. We need to set the beat to be able to see the trend. Meanwhile, the average daily volatility since the beginning of the week is 49 points, which is already higher than the statistical data [see the volatility table at the end of the article].
Analyzing the past day by the minute, we see the same consolidation that was mentioned above, where even the start of the European trading session did not give an incentive to market participants, as if there was a kind of accumulation of forces. The main jump and exit from the consolidation framework occurred in the period 14: 45-15: 45 London time [time on the trading terminal], where we saw a local, but still an impulse jump in the price.
As discussed in the previous review , everyone was waiting for a breakout, where speculators were working on the jump, but the rest of the traders were working at fixing the price below 1.0980. In terms of the main positions, this is just the beginning, as there is a quote formation, where the risk of a price return higher than 1,1000 is not excluded, so a step-by-step entry of volumes is made, and Stop Loss is not forgotten.
Looking at the trading chart in general terms [the daily period], we see a broad discussion of the recovery process, which is not surprising, since the breakdown of the second stage [1,1000] signaled possible prospects. Let me remind you that the main trend in the market is downward, and the oblong correction has been on the market since October 1 last year.
The news background of the previous day included data on the applications for unemployment benefits in the United States, where they did not predict any drastic changes, but they came. So, initial applications decreased by 15 thousand, but the repeated ones increased by 48 thousand. Meanwhile, the forecast for it is a decline of 8 thousand.
The reaction to the statistical data was extremely interesting, as the dollar did not notice any pressure on itself. However, about half an hour after the publication, it moved to a local strengthening, contrasting all the logic of fundamental analysis. There are speculations that the market participants were preparing for the US Department of Labor's report.
In terms of general information, we have the lingering noise associated with Brexit's transition period, and the escalating fear from the media about the coronavirus. In terms of a positive background, we have the completion of the impeachment process of Mr. Trump, as well as the improvement of the US-China trade relations. So, China will reduce duties on a number of goods imported from the United States by half.
"Starting from January 13, on February 14 (6:01 London time), the rate will be adjusted to 5% for goods whose duties have been increased by 10% since September 1, 2019. At the same time, the rate will be adjusted to 2.5% for goods on which duties have been increased by 5%, "the Ministry said in a statement.
Today, in terms of the economic calendar, we have a report from the US Department of Labor, where, in line with forecasts, 160 thousand new jobs must be created outside of agriculture. Thus, based on the ADP report, which was published recently, much more significant changes can occur in terms of the growth of new jobs. These could affect the level of unemployment, which is projected to increase from 3.5% to 3.6%.
In terms of the economic calendar, the upcoming trading week is highlighted by the data on US inflation, where a slowdown is expected. We also have preliminary data on EU GDP, as well as employment levels.
The most interesting events are displayed below - - ->
Tuesday, February 11
USA 16:00 London time - The number of open vacancies in the labor market (JOLTS)
PREV: 6.800 M - - -> Forecast: 7.233 M
Tuesday, February 12
EU 11:00 London time - Industrial output
Thursday, February 13
US 14:30 London time -Basic consumer price index:
PREV: 2.3% - - -> Forecast: 2.2%
Friday, February 14
EU 11:00 London time - Preliminary GDP data: PREV: 1.0%
EU 11:00 London time - Employment rate (preliminary): PREV: 0.9%
US 14:30 London time - Volume of retail sales
US 14:30 London time - Industrial output
Further development
Analyzing the current trading schedule, we can see the desire to continue the downward movement, which in terms of technical analysis, is a completely adequate situation. At the same time, if we make a reference to the upcoming publication of the reports from the US Department of Labor, as well as the process of fixing the quotes, then a stagnation in the border at the level of 1.1000 could theoretically occur. Afterwards, if the data on the report matches with the forecast, we will go down gradually, and be in the cycle of recovery.
Detailing the time period by minutes, we can see that the overnight consolidation moved into a downward impulse at the start of the European trading session.
In terms of the emotional mood of the market participants, we see an influx of trading interest not only from the speculators, but also from the major traders. In fact, this is a good signal for stable activity, expressed in the market volatility.
As a result, traders carefully analyzed the behavior of the quote, as the first profit-taking is already close. In terms of speculative operations, the market jumps continue here.
The quote is likely aimed at the stage # 3/1 [1.0950], where we should be extremely attentive at the price fixing points. Note that we are already getting closer to the end of the recovery, and variable spikes may happen here. In terms of news background, do not forget about the report coming today, and it is worth looking closely at the theory described above.
Based on the above information, we will have the following trading recommendations:
- Together with a negative data on the Ministry of Labor's report, consider buy positions if the price fixes above 1.0980.
- Sell positions are held towards 1.0950. Maintaining a downward mood in H4, and consider further deals if the price fixes below 1.0950.
Indicator analysis
Analyzing the different sectors of timeframes (TF), we can see that the indicators of the technical instruments are focused on the downward trend, reflecting market recovery.
Volatility for the week / Volatility measurement: Month; Quarter year
The volatility measurement reflects the average daily fluctuation, based on the calculation for the Month / Quarter / Year.
(February 7 was based on the time of publication of the article)
The current volatility is 29 points, which is not bad for this period of time. It is likely to assume that against the background of the Ministry of Labor's report, we can still see a characteristic acceleration.
Key level
Resistance zones: 1,1000***; 1,1080**; 1,1180; 1,1300**; 1,1450; 1,1550; 1,1650*; 1,1720**; 1,1850**; 1,2100
Support areas: 1,0900/1,0950**; 1,0850**; 1,0500***; 1,0350**; 1,0000***.
* Periodic level
** Range level
***Psychological level
***** The article is based on the principle of conducting a transaction, with daily adjustments.