From a comprehensive analysis, we see a descent to a new stage, after which there was a technical rebound. Now about the details. The downward inertia move fixes new records, where the next step of 1.0700 is considered broken, which means that April 2017 has already been touched. In fact, panic continues to play into the hands of speculators, who grasp the external background and show ultra-high activity. It is worth noting that for eight trading days, the downward inertia has been maintained, which has acquired a scale of more than 800 points, which means that there is an overheating of short positions in the market, but they turn a blind eye to it. This factor may not be noticed until the overheating is of such magnitude that it will simply be taken out by a local jump, as in the example of the pound/dollar pair. In our case, there are still maneuvers to reduce.
Regarding the theory of downward development, we see that only 325 of the current achievement remains to the historical minimum, which is not considered impossible. Let me remind you that the next steps are located in the values of 1.0500, 1.0350, and at least 1.0325. Regarding the parity of 1.0000, I will say that everything is possible and do not forget that we were already below unity, open the charts of 2000-2002.
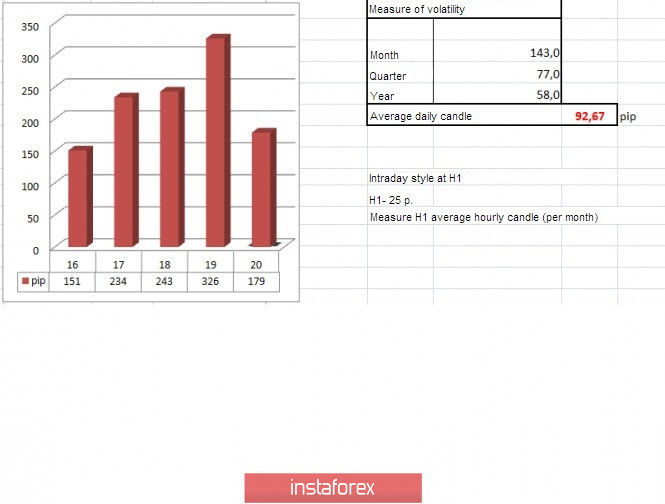
In terms of volatility, we again record an ultra-high indicator that exceeds the average value by 254%. The dynamics are growing in proportion to the panic, and speculators are taking advantage of the situation, which I advise you to do.
Volatility details: Monday-155 points; Tuesday-183 points; Wednesday-115 points; Thursday-278 points; Friday-166 points Monday-151 points; Tuesday-234 points; Wednesday-243 points; Thursday-326 points. The average daily indicator relative to the volatility dynamics is 92 points (see the volatility table at the end of the article).
Analyzing the past day by the minute, we see that the downward turn was set with the start of the European session and lasted until the closing of the daily candle. In fact, the quote managed to reach the next step of 1.0700 and locally fixed below, where the price found variable support in the face of the value of 1.0655.
As discussed in the previous review, traders continue to work on the downside, making a regrouping of trading forces from time to time. This time, the gulf occurred below the mark of 1.0775.
The recommendation from Thursday matched where it was received.
(The main positions for sale are considered after fixing the price below 1.0775.)
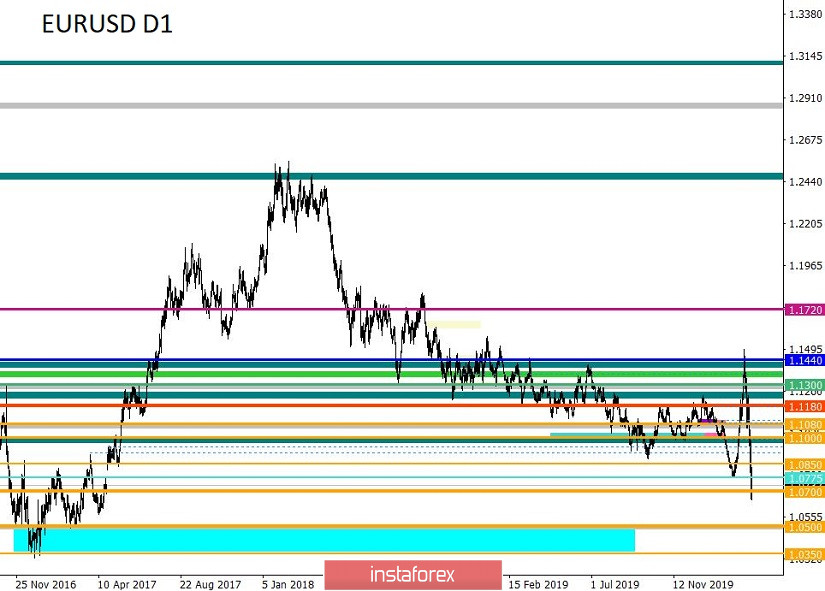
Looking at the trading chart in general terms (daily period), we see that the downward trend continues to develop, where there is not much left to update the historical lows.
The news background of the past day had data on applications for unemployment benefits in the United States, which recorded an increase in applications by 72,000 (primary +70,000; repeated +2,000). The data signals that the situation in the US labor market is not the best.
In terms of the general information background, we continue to record a panic mood based on the COVID-19 virus, where, according to the epidemiological situation, Italy broke the record for the number of fatal cases worldwide. Europe is increasing the rate of growth of cases, as can be seen from the statistics below:
Italy - 41,035 (per day +5,322)
Spain - 18,077 (per day +3,308)
Germany - 15,320 (per day +2,993)
France - 10,995 (per day +1,861)
In turn, the European Union's chief Brexit negotiator, Michel Barnier, has contracted the coronavirus. He wrote about it on his Twitter page.
"I would like to inform you that my test came back positive for #COVID19. I feel good and in a good mood. I follow all the necessary instructions, as does my team. For all those who have already suffered, and for all those who are currently in isolation, I want to hope that we will go through this together." – @MichelBarnier
As we can see from the above material, the external background continues to exert the strongest pressure on financial markets.
Today, in terms of the economic calendar, we do not have significant statistics for Europe and the United States, so the main focus will be on the external background, in particular, the developing COVID-19 virus.
The upcoming trading week in terms of statistics has preliminary data on the PMI in the EU, as well as the final indicators for the GDP of the United States. The focus will also remain on the coronavirus, which will have a strong influence on the external background.
The most interesting events are displayed below:
On Tuesday, March 24
EU 10:00 London time - a composite index of business activity in the manufacturing sector Markit preliminary: Prev 51.6 -> Prog. 51.0
USA 14:45 London time - the index of business activity in the services sector Markit (March) preliminary
USA 15:00 London time - new home sales (m/m) (February): Prev 7.9% -> Prog. 3.7%
On Wednesday, March 25
USA 13:30 London time - durable goods orders (February)
On Thursday, March 26
13:00 London time - a meeting of the Bank of England
USA 13:30 London time - applications for unemployment benefits
USA 13:30 London time - GDP: Prev 2.1%
Further development
Analyzing the current trading chart, we see the same technical rebound from the lows, where the quote locally managed to reach the level of 1.0831, after which there was a return to the level of 1.0700. In fact, we see that the downward mood persists in the market, where the level of 1.0700 is no longer the main support since there was a shift to the area of 1.0650/1.0700. Thus, in the event of a breakdown of this area, the downward development will continue its formation, where the next stages are at the levels of 1.0500; 1.0350.
In terms of emotional mood, we see how the market is feverish, and the coefficient of speculative operations is growing unquenchably. Activity will still be high, as the external background is the main catalyst.
By detailing the available period every minute, we see the same pattern, which has already been repeatedly written about in reviews. The start of the European session leads to new activity and against the current background, this activity is directed in the downward direction.
In turn, traders are already entering short positions after breaking the low of the previous day.
We can assume that in the case of a breakdown of the area of 1.0650/1.0700, the downward move will resume, where the quote will go to the next stage of 1.0500. An alternative scenario will be considered if the price is fixed higher than 1.0850.
Based on the above information, we will output trading recommendations:
- We consider buying positions if the price is fixed higher than 1.0850, with the prospect of a move to 1.0955-1.1000.
- We consider selling positions if the price is fixed below the area of 1.0650/1.0700, with the prospect of a move to 1.0500-1.0350.
Indicator analysis
Analyzing different sectors of timeframes (TF), we see that the indicators of technical instruments unanimously signal sales due to the continuing downward background.
Volatility for the week / Measurement of volatility: Month; Quarter; Year.
Volatility measurement reflects the average daily fluctuation from the calculation for the Month / Quarter / Year.
(March 20 was based on the time of publication of the article)
The volatility of the current time is 181 points, which already exceeds the daily average by 94%. It is likely to assume that the external background and speculative activity will continue to increase volatility in the market.
Key levels
Resistance zones: 1.0775*; 1.0850**; 1.1000***; 1.1080**; 1.1180; 1.1300; 1.1440; 1.1550; 1.1650*; 1.1720**; 1.1850**; 1.2100.
Support zones: 1.0700 (1.0650); 1.0500***; 1.0350**; 1.0000***.
* Periodic level
** Range level
*** Psychological level