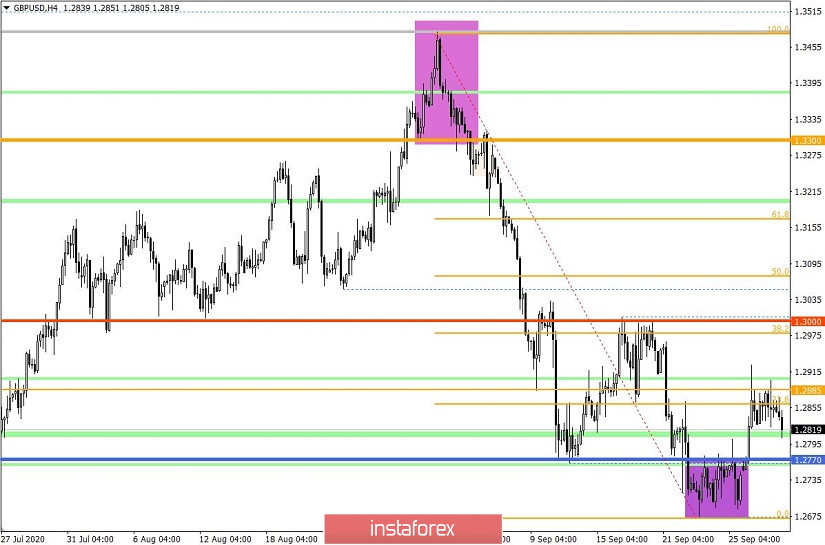
The GBP / USD pair is currently in the stage of a correction, but yesterday, there was a stagnation at price levels 1.2822 / 1.2900, which could well serve as a signal of the end of the process. In addition, the bearish sentiment is prevailing all throughout the market, and it could result in a strong downward move, perhaps even below the current local lows.
Thus, if we analyze the M15 chart and look closely at the trades set yesterday, we will see that speculative positions surged in the market at 15: 15-17: 00, particularly at price levels 1.2822 / 1.2900.
The lowest activity was also recorded in terms of daily dynamics, so as a result, volatility was only 78 points, which is 37% below the average level. This very phenomenon indicates an upcoming surge in activity, as well as the completion of the current correction.
This is because as discussed in the previous review , market participants used the levels 1.2825 / 1.2885 / 1.2910 as a temporary platform for a slowdown, setting off such a result.
Meanwhile, if we look at the daily chart, we will see the consistent downward price movement with a scale of more than 800 points. Two corrections from this movement were recorded this September.
With regards to news, a better-than-expected statistics were published for the UK lending market yesterday, one of which was the strong improvement on approved mortgage loans. According to the latest report, it number to 84.7 thousand, while the volume of mortgage lending increased from £ 2.90 billion to £ 3.10 billion.
At the same time, the House of Commons have passed the third reading of the controversial internal market bill, which, if approved, would allow UK to violate the terms of the Brexit agreement. The next step is a formal consideration of the House of Lords, however, if this really happens, negotiations as well as relationship between the UK and the EU could break down.
Any update in this direction would lead to more speculative positions in the GBP / USD pair.
Back to statistics, the final data for the UK 2nd quarter GDP was released today, but it revealed that economic decline accelerated from -1.7% to -21.5%.
The same data will be published in the afternoon for the US GDP, but this time, it is expected to show an economic decline of -9.1% in annual terms, which coincides with the preliminary estimate.
However, what investors will pay particular attention to is the upcoming ADP report on the level of employment in the US private sector, where there is an expected increase of employment by 610,000. If this happens, the US dollar will rise in the markets.
US 13:15 - ADP Employment change report (September)
US 13:30 - GDP (Q2)
Further development
As we can see in the trading chart, the quote has broken out of the earlier price range (1.2822 / 1.2900) during the start of the European session, as a result of which the pound traded at a price of 1.2820. If the quote continues to consolidate below this level, short positions will rise again, which will then lead to a further decline towards 1.2770-1.2720.
But if the quote returns to the previous levels, the pound will move towards 1.2900, where activity will be high again in the market.
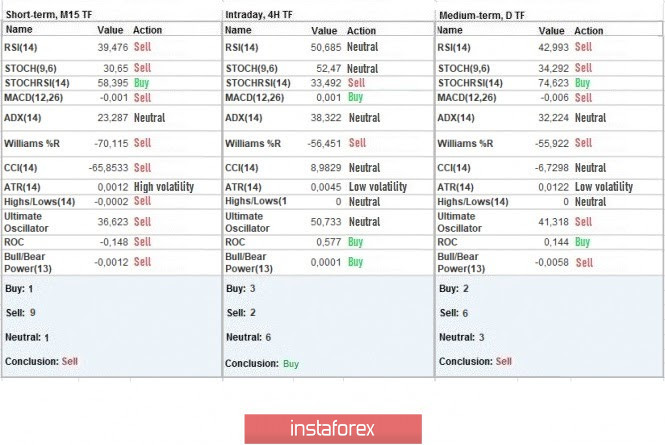
Indicator analysis
Looking at the different time frames (TF), we can see that the indicators on minute period signal SELL due to a local breakout from the earlier price range. Meanwhile, the hourly period signals BUY due to the current bullish correction in the GBP / USD pair. The daily period, which as before signals SELL, is still under the depth of the September decline.
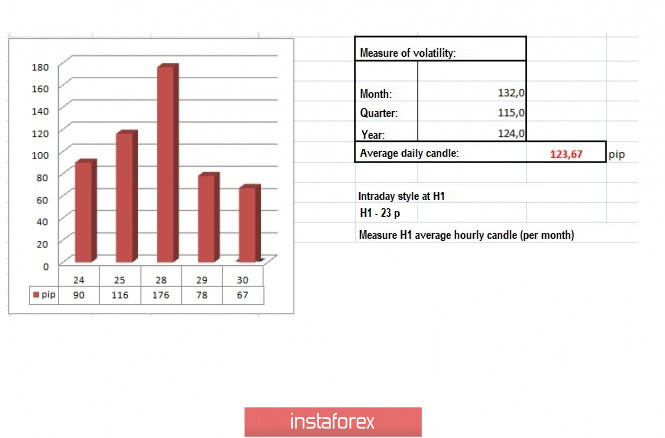
Weekly volatility / Volatility measurement: Month; Quarter; Year
Volatility is measured relative to the average daily fluctuations, which are calculated every Month / Quarter / Year.
(The dynamics for today is calculated, all while taking into account the time this article is published)
Volatility is at 67 points, which is 45% below the average value.
The current accumulation has already managed to concentrate a sufficient amount of trading volumes, so as a result, an acceleration is to follow soon.
Key levels
Resistance zones: 1.2885 *; 1.3000 ***; 1.3200; 1.3300 **; 1.3600; 1.3850; 1.4000 ***; 1.4350 **.
Support Zones: 1.2770 **; 1.2620; 1.2500; 1.2350 **; 1.2250; 1.2150 **; 1.2000 *** (1.1957); 1.1850; 1.1660; 1.1450 (1.1411).
* Periodic level
** Range level
*** Psychological level
Also check trading recommendations for the EUR/USD pair here, or brief trading recommendations for the EUR/USD and GBP/USD pairs here.