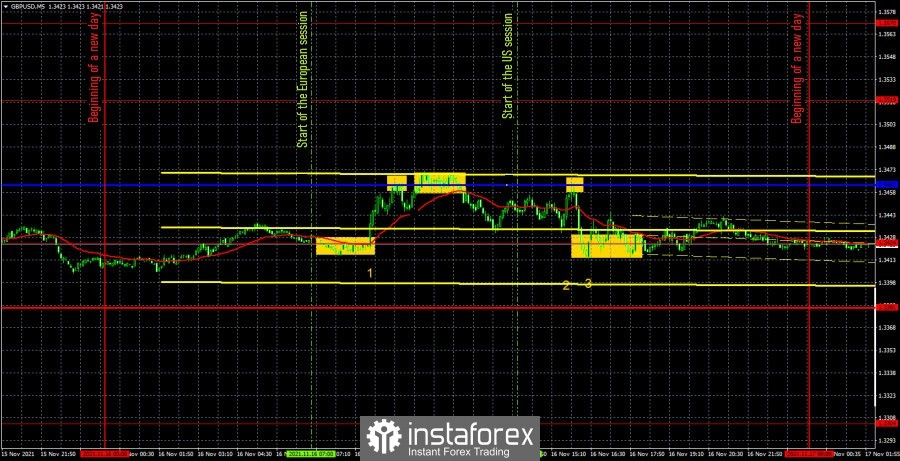
GBP/USD 5M

The GBP/USD pair was also trading not in the best way on Tuesday. By and large, the pair spent most of the day between the Kijun-sen line and the level of 1.3424. But even with these two marks, it could not work in a clear and accurate manner. Thus, almost all of yesterday's signals turned out to be inaccurate and blurry. As for macroeconomic reports, it had a certain impact on the course of trading. Moreover, it began to provide it from the very morning, when data on unemployment and wages were published in the UK, which turned out to be stronger than the predicted values (figure "1" in the chart). At the same time, the first buy signal was formed in the form of a rebound from the extremum level of 1.3424, which should have been worked out with a long position, since the "macroeconomics" was in favor of the pound. The upward movement ended near the Kijun-sen line, from which the pair bounced a total of two times and is also very inaccurate. And at the beginning of the US trading session, there was a third rebound from this line. Thus, we managed to earn about 15 points on a long position, as the pair did everything possible to make the profit smaller, forming two huge candles on the formation of the signal and on its cancellation. Short positions should have been opened on the first rebound from the critical line, but they closed at breakeven by Stop Loss, since the price was able to go down 20 points, and then returned to Kijun-sen. However, at the next sell signal, the shorts should have been reopened, especially since this corresponded to the nature of the statistics from overseas, published around the same time. As a result, the price fell back to the level of 1.3424, which is no longer relevant from today. It generates inaccurate signals. Nevertheless, there was no clear breakthrough of this level, so a short position should have been closed near this level. The profit was about 13 points. But a new long position should no longer have been opened, although this decision was not at all obvious. Nevertheless, the pair began to "dance" in all directions around the level of 1.3424, so there was no question of any clear signals.
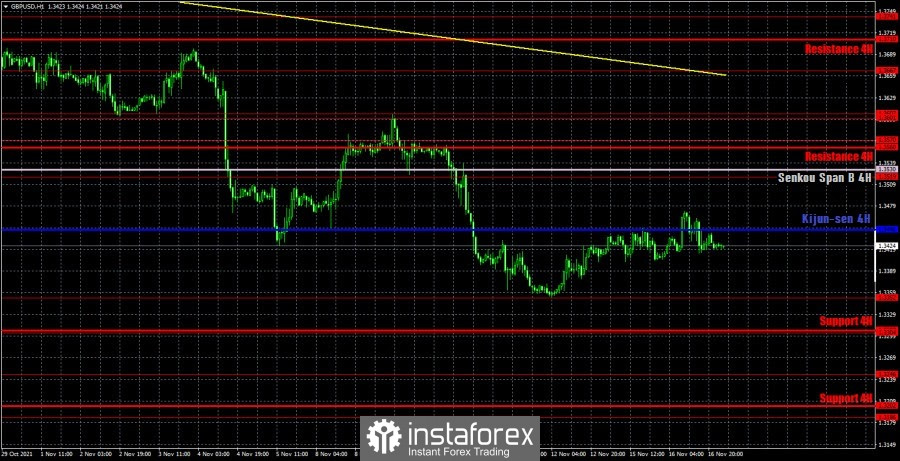
GBP/USD 1H

The pound/dollar pair maintains a downward trend on the hourly timeframe, but continues to be quite far from the trend line. At the moment, the upward correction is still present, but the price has not managed to reach the critical line in a few days yet – the movement is so weak now. Thus, as long as the price is below the Kijun-sen line, the downward movement can resume at any moment. If the bulls overcome this line, the correction may continue with the goals of the Senkou Span B line and the trend line. We highlight the following important levels on November 16: 1,3246, 1,3304, 1,3424, 1,3519, 1,3570. The Senkou Span B (1.3618) and Kijun-sen (1.3475) lines can also be signal sources. It is recommended to set the Stop Loss level to breakeven when the price passes in the right direction by 20 points. The lines of the Ichimoku indicator can move during the day, which should be taken into account when searching for trading signals. Reports on unemployment, applications for unemployment benefits, as well as changes in average wages will be published in the UK on Tuesday. We do not consider these reports important, therefore, if the reaction of the markets follows them, it is unlikely to be strong. A much more important report will be released in America - retail sales.
We recommend you to familiarize yourself:
Overview of the EUR/USD pair. November 17. Christine Lagarde, what are you doing?
Overview of the GBP/USD pair. November 17. Brexit and the Northern Ireland Protocol. The conflict has not been resolved.
Forecast and trading signals for EUR/USD for November 17. Detailed analysis of the movement of the pair and trade deals.
COT report

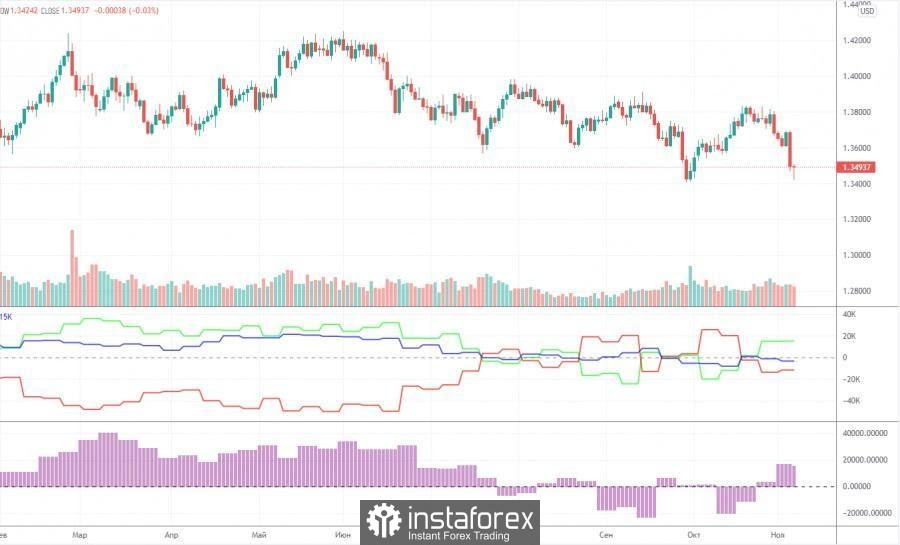
The mood of professional traders practically did not change during the last reporting week (October 26-November 1). However, it should be noted that the two most important days of last week – Wednesday and Thursday - when all the strongest movements occurred, were not included in the latest report. That is, in a week we will be able to see how much and in which direction the mood of professional traders has changed. In the meantime, we can only draw the same conclusions as a week ago. The green and red lines of the first indicator continue to constantly change the direction of movement, constantly intersecting. This suggests that big players themselves do not understand what to do with the pound. However, this can be clearly seen from the very schedule of the pair's movement, starting from July. These four months, the pound/dollar pair has been between the levels of 1.3400 and 1.4000, that is, in the horizontal channel. It was during this period of time that commercial and non-commercial traders changed their mood almost every week. Thus, taking into account the previous changes, we would assume that a new growth of the British currency will begin in the near future with the prospect of a 500-point rise. Moreover, the results of the Bank of England meeting were not dovish. The British currency has fallen undeservedly, which means that the markets may soon recoup this injustice. It should also be noted that during the reporting week, professional traders opened 5.8 buy contracts (longs) and 7.5 thousand sell contracts (shorts). Thus, the net position has not changed much.
Explanations for the chart:
Support and Resistance Levels are the levels that serve as targets when buying or selling the pair. You can place Take Profit near these levels.
Kijun-sen and Senkou Span B lines are lines of the Ichimoku indicator transferred to the hourly timeframe from the 4-hour one.
Support and resistance areas are areas from which the price has repeatedly rebounded off.
Yellow lines are trend lines, trend channels and any other technical patterns.
Indicator 1 on the COT charts is the size of the net position of each category of traders.
Indicator 2 on the COT charts is the size of the net position for the non-commercial group.