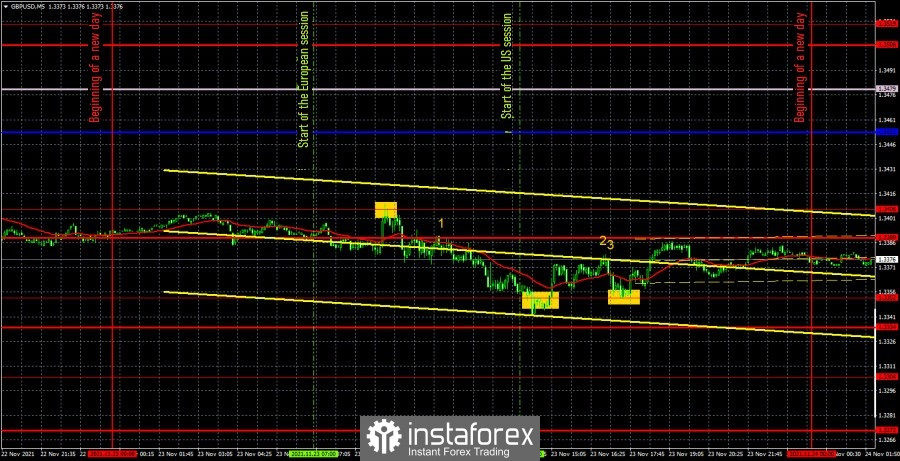
GBP/USD 5M

The GBP/USD pair continued absolutely indistinct movements on Tuesday. By this word we mean the absence of a pronounced trend movement or flat. That is, the pair did not seem to stand in one place, but at the same time there was no clear trend either. The situation was roughly the same with macroeconomic reports. Data on business activity in the manufacturing and services sectors were published in the United States and Britain, but these four reports were ignored by the markets in the absence of significant changes (numbers "1" and "2" in the chart above). The same applies to the fundamental background, as the speech of Bank of England Governor Andrew Bailey (the number "3" in the chart) did not give any new information to the market participants. Consequently, there was definitely nothing to react to on Tuesday. The volatility of the pound/dollar pair amounted to 67 points, which is a "medium-low" value. However, all this did not prevent the pair from forming a pair of very attractive trading signals. The first of them formed around the level of 1.3406. On the hourly timeframe, you can clearly see how many times the price bounced off this level, so the signal turned out to be strong. After its formation, the pair went down by about 50 points and reached the extremum level of 1.3352. At first, it even overcame it, since a move below the level by 10 points can hardly be considered a rebound. Thus, the short position should be left when the price settled above the level of 1.3352. As a result, the profit is 38 points. Then it was necessary to open long positions, which could bring another 20 points of profit. At first, the pound could not continue its upward movement and returned to the level of 1.3352 in order to rebound again, but since the Stop Loss order was not placed at breakeven, the long position should not have been closed. But it was possible to get rid of longs in the late afternoon, when the price approached the resistance level of 1.3389.
GBP/USD 1H
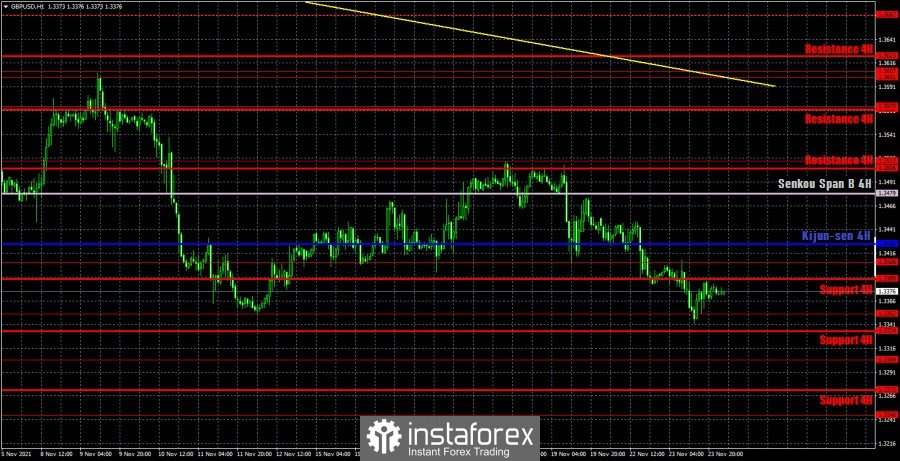
The pound/dollar pair continues its downward movement on the hourly timeframe, but could not overcome the level of 1.3352, from which it rebounded for the second time. Thus, the pound has ghostly chances of growth, but they are really low now. The downward trend continues, and the pair has just completed the upward correction. Therefore, it is more likely that the downward movement will continue. We distinguish the following important levels on November 24: 1.3304, 1.3352, 1.3406, 1.3513. Senkou Span B (1.3479) and Kijun-sen (1.3426) lines can also be signal sources. Signals can be "rebounds" and "breakthroughs" of these levels and lines. It is recommended to set the Stop Loss level at breakeven when the price passes 20 points in the right direction. The Ichimoku indicator lines can move during the day, which should be taken into account when looking for trading signals. There will be no interesting events or publications on Wednesday in the UK. Thus, traders will have to focus on US reports and events. We believe that the report on GDP for the third quarter will have the greatest significance, as its value may increase by 0.2% compared to the first estimate. The evening publication of the "Fed minutes" will also be important, since at the last meeting an important decision was made to curtail the QE program.
We recommend you to familiarize yourself:
Overview of the EUR/USD pair. November 24. European economy may need new stimulus... Coronavirus continues to rage
Overview of the GBP/USD pair. November 24. The British pound tried to perk up, but quickly wilted. Coronavirus is attacking Britain too
Forecast and trading signals for EUR/USD for November 24. Detailed analysis of the movement of the pair and trade deals.
COT report
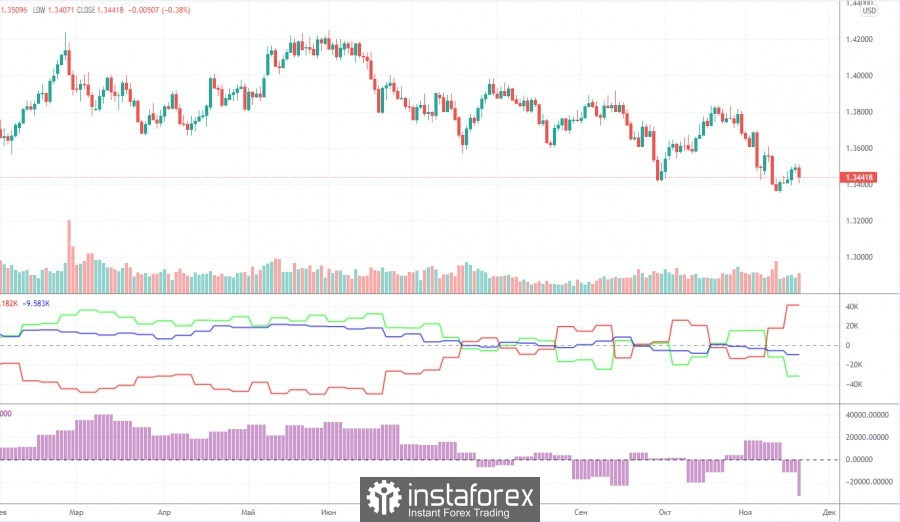
The mood of professional traders became much more bearish during the last reporting week. However, this should not be surprising, since the mood of major players has been constantly changing over the past few months, which perfectly reflects the first indicator in the chart above. The green and red lines, which indicate the net positions (in other words, the mood) of non-commercial and commercial traders, constantly change the direction of movement and constantly change their position relative to the zero level. The last reporting week only confirmed us in these conclusions. The green line has dropped significantly again, and the red line has increased significantly, although a couple of weeks ago it was the opposite. Thus, formally, the mood of professional traders has become more bearish, but in reality it changes every couple of weeks, so it is impossible to make a long-term conclusion. The non-commercial group closed 4,000 buy contracts (longs) and opened 17,000 sell contracts (shorts) during the reporting week. Thus, the net position decreased by 21,000 contracts at once, which is a lot for the pound. However, this does not matter much, since the net position of non-commercial traders also constantly jumps up and down, which is eloquently signaled by the second indicator in the chart above. It should also be noted that in the long term, the pound/dollar exchange rate itself also constantly jumps up and down. Thus, it is not possible to make a long-term forecast based on COT reports.
Explanations for the chart:
Support and Resistance Levels are the levels that serve as targets when buying or selling the pair. You can place Take Profit near these levels.
Kijun-sen and Senkou Span B lines are lines of the Ichimoku indicator transferred to the hourly timeframe from the 4-hour one.
Support and resistance areas are areas from which the price has repeatedly rebounded off.
Yellow lines are trend lines, trend channels and any other technical patterns.
Indicator 1 on the COT charts is the size of the net position of each category of traders.
Indicator 2 on the COT charts is the size of the net position for the non-commercial group.