empty
 
 
07.04.2022 11:45 AM
Trading plan for starters of EUR/USD and GBP/USD on April 7, 2022

Details of the economic calendar from April 6

The producer price index in the European Union unexpectedly rose less than forecast from 30.6% to 31.4%, with an expectation of growth to 36.0%. Based on the data obtained, inflation in the EU will not grow as fast as expected, which is a positive moment for the European currency.

During the American trading session, the minutes of the recent meeting of the Federal Open Market Committee (FOMC) were published. Traders once again saw the demands for tightening monetary policy.

The main theses of the FOMC protocol:

- geopolitics adds to inflation

- it is appropriate to curtail incentives

- the reduction of the balance sheet will accelerate to $60 million in state bonds and $35 billion in mortgages on real estate

- it is appropriate to start selling real estate mortgages as part of the balance sheet reduction

- it may be appropriate to increase the rate immediately by 0.5%

- the Fed's balance sheet will shrink faster in this cycle compared to previous cycles

- many agree that the reduction of the Fed's balance sheet may begin after the May FOMC meeting

Analysis of trading charts from April 6

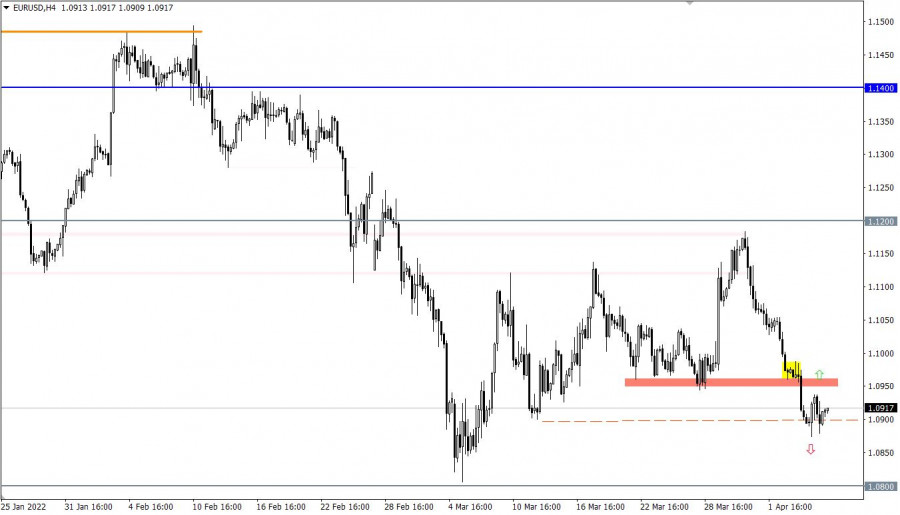
The EURUSD currency pair slightly slowed down the downward cycle around the value of 1.0900. This led to an attempt to rebound the price, but ended up with a variable amplitude scale of 50 points.

On the trading chart of the daily period, there is a recovery of dollar positions by more than 75% relative to the corrective move from the support level of 1.0800.

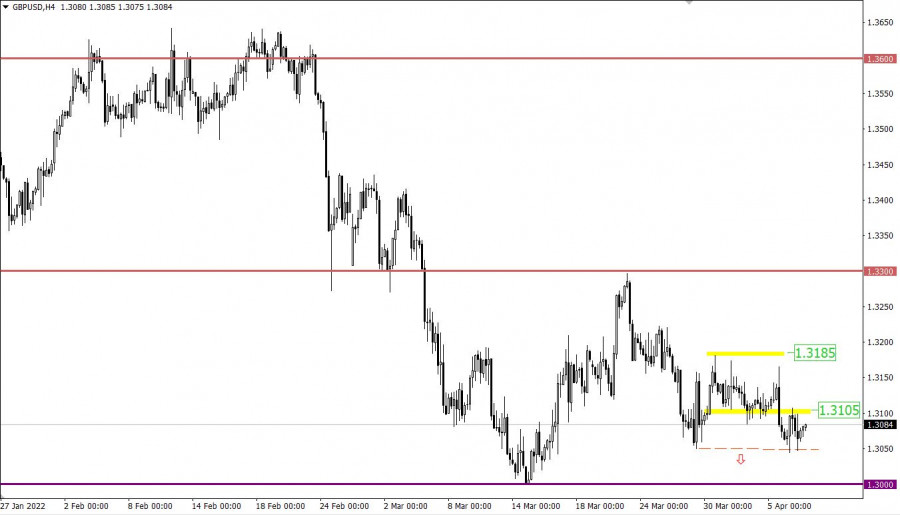
Yesterday, the GBPUSD currency pair showed average activity, as a result of which the quote temporarily returned to the lower boundary of the previously passed flat 1.3105/1.3180. This movement may indicate a break/pullback trading method, where the lower border of 1.3105 plays the role of resistance.

This image is no longer relevant

Economic calendar for April 7

Today, the eurozone retail sales data for February will be released, which is expected to decline to 4.8% (YoY). If we consider the data month by month, an increase of 0.6% is possible. It is worth considering that these are indicators for February, and given the current situation in the world, the March data will be much worse.

During the American trading session, weekly data on jobless claims will be published, which is expected to increase in volume. This is a negative factor for the U.S. labor market, which may have a negative impact on the dollar.

Statistics details:

The volume of continuing claims for benefits may increase from 1.307 million to 1.311 million.

The volume of initial claims for benefits may slightly decrease from 202,000 to 200,000.

Time targeting

EU Retail sales - 09:00 UTC

US Jobless Claims - 12:30 UTC

Trading plan for EUR/USD on April 7

Despite the local stagnation, there is still a downward interest in the market. Therefore, keeping the price below 1.0875 in a four-hour period will lead to a subsequent increase in the volume of short positions, which will lower the euro exchange rate to the support level of 1.0800.

An alternative scenario for the development of the market will be considered by traders if the price is kept above the value of 1.0950. This step may well lead to a full-size pullback towards the 1.1000 level.

This image is no longer relevant

Trading plan for GBP/USD on April 7

In this situation, there is a slowdown in the downward move, where the area of 1.3050/1.3060 serves as a support. Keeping the price below these values will lead to the subsequent weakening of the British currency, at least to the support level of 1.3000. Until then, a temporary amplitude of 1.3050/1.3105 is possible.

This image is no longer relevant

What is reflected in the trading charts?

A candlestick chart view is graphical rectangles of white and black light, with sticks on top and bottom. When analyzing each candle in detail, you will see its characteristics of a relative period: the opening price, closing price, and maximum and minimum prices.

Horizontal levels are price coordinates, relative to which a stop or a price reversal may occur. These levels are called support and resistance in the market.

Circles and rectangles are highlighted examples where the price of the story unfolded. This color selection indicates horizontal lines that may put pressure on the quote in the future.

The up/down arrows are the reference points of the possible price direction in the future.

Gven Podolsky,
InstaForex के विश्लेषणात्मक विशेषज्ञ
© 2007-2024
Earn on cryptocurrency rate changes with InstaForex
Download MetaTrader 4 and open your first trade
  • Grand Choice
    Contest by
    InstaForex
    InstaForex always strives to help you
    fulfill your biggest dreams.
    कॉन्टेस्ट में हिस्सा लें
  • चैन्सी डिपॉजिट
    $ 3,000 के साथ अपना खाता जमा करें और प्राप्त करें $1000 अधिक!
    में अप्रैल हम आकर्षित करते हैं $1000 चैंसी डिपॉज़िट में
    ट्रेडिंग अकाउंट में $ 3,000 जमा करके जीतने का अवसर प्राप्त करें इस शर्त को पूरा करके आप प्रतियोगिता में भाग ले सकते हैं
    कॉन्टेस्ट में हिस्सा लें
  • ट्रेड वाइज़, विन डिवाइस
    कम से कम $500 के साथ अपने खाते में टॉप अप करें, कॉन्टेस्ट के लिए साइन अप करें और मोबाइल डिवाइस जीतने का मौका पाएं।
    कॉन्टेस्ट में हिस्सा लें
  • 100% बोनस
    अपनी जमा राशि पर 100% बोनस प्राप्त करने का आपका अनूठा अवसर
    बोनस पायें
  • 55% बोनस
    अपनी प्रत्येक डिपॉजिट पर 55% बोनस के लिए आवेदन करें
    बोनस पायें
  • 30% बोनस
    हर बार खाता टॉप अप करने पर 30% बोनस प्राप्त करें
    बोनस पायें

अनुशंसित लेख

अभी बात नहीं कर सकते?
अपना प्रश्न पूछें बातचीत.
Widget callback