empty
 
 
09.02.2023 10:03 AM
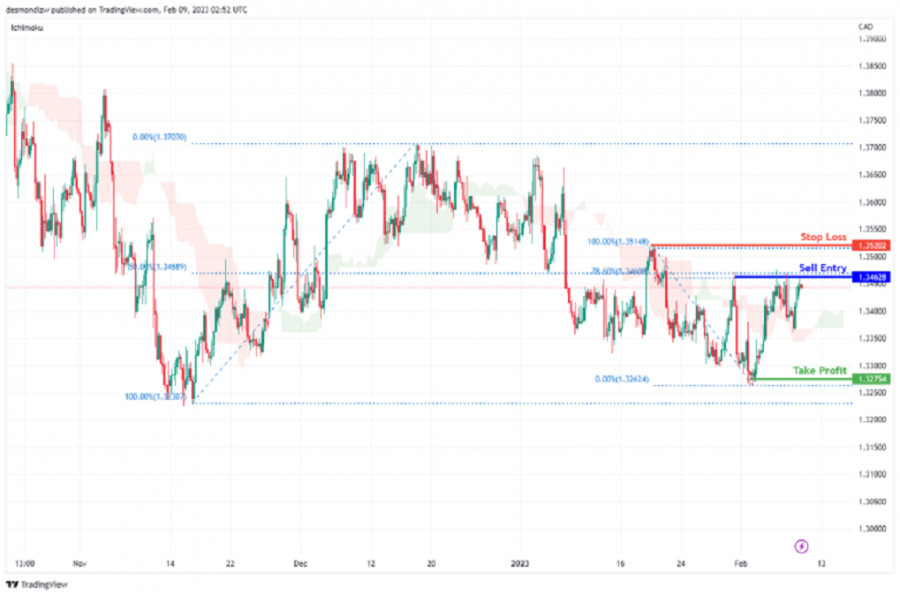
USDCAD Potential for Bearish Drop to recent swing low

This image is no longer relevant

Description :

Looking at the H4 chart, my overall bias for USDCAD is bearish as there is a descending trend line, Looking for a sell entry at 1.34628 where below the overlap support and the recent swing high We are looking to take profit at 1.32754, which is the recent swing low, Stop loss will be placed at 1.35202, where the recent swing high.

Trading Recommendation

Entry: 1.34628

Reason for Entry: recent swing high + descending trend line + 78.6% Fibonacci retracement

Take Profit: 1.32754

Reason for Take Profit:

Recent swing low

Stop Loss: 1.35202

Reason for Stop Loss:

Previous swing high

Dean Leo,
InstaForex के विश्लेषणात्मक विशेषज्ञ
© 2007-2023
EURUSD
Euro vs US Dollar
समय सीमा चुनें
5
मिनट
15
मिनट
30
मिनट
1
घंटा
4
घंटे
1
दिन
1
सप्ताह
ट्रेड शुरू करें
ट्रेड शुरू करें
XAUUSD, Day | Potential Reversal from a key level ?
The XAU/USD chart currently has bearish momentum, with potential for a drop towards the first support level at 1948, an overlap support level. If prices continue to fall, they could test the second support level at 1881, another overlap support level and the 61.80% Fibonacci retracement level. The.
Author: Dean Leo
01:49 2023-03-27 UTC--4
1390
XAUUSD, Day | Continue to 1st Support?
BTC/USD chart shows bearish momentum with potential for drop to first support level. Overall, Bitcoin's momentum against the US dollar is bearish, suggesting possible further price decline. A bearish reaction from the first resistance level could lead to a drop towards the first support level at.
Author: Dean Leo
01:48 2023-03-27 UTC--4
1210
WIT(OIL), Day | Strong descending trendline ?
WTI oil prices have turned bearish as they fell below a crucial support level. The chart indicates that the momentum has shifted to the downside, signaling a potential further decline in prices. Consequently, the overall bias for WTI oil prices is now bearish. In the near term, prices could.
Author: Dean Leo
01:46 2023-03-27 UTC--4
1135
Show more
  • Grand Choice
    Contest by
    InstaForex
    InstaForex always strives to help you
    fulfill your biggest dreams.
    कॉन्टेस्ट में हिस्सा लें
  • चैन्सी डिपॉजिट
    $ 3,000 के साथ अपना खाता जमा करें और प्राप्त करें $8000 अधिक!
    में मार्च हम आकर्षित करते हैं $8000 चैंसी डिपॉज़िट में
    ट्रेडिंग अकाउंट में $ 3,000 जमा करके जीतने का अवसर प्राप्त करें इस शर्त को पूरा करके आप प्रतियोगिता में भाग ले सकते हैं
    कॉन्टेस्ट में हिस्सा लें
  • ट्रेड वाइज़, विन डिवाइस
    कम से कम $500 के साथ अपने खाते में टॉप अप करें, कॉन्टेस्ट के लिए साइन अप करें और मोबाइल डिवाइस जीतने का मौका पाएं।
    कॉन्टेस्ट में हिस्सा लें
  • 100% बोनस
    अपनी जमा राशि पर 100% बोनस प्राप्त करने का आपका अनूठा अवसर
    बोनस पायें
  • 55% बोनस
    अपनी प्रत्येक डिपॉजिट पर 55% बोनस के लिए आवेदन करें
    बोनस पायें
  • 30% बोनस
    हर बार खाता टॉप अप करने पर 30% बोनस प्राप्त करें
    बोनस पायें

Recommended Stories

संयुक्त राज्य अमेरिका डॉलर करेंसी सूचकांक के दैनिक मूल्य मूवमेंट का तकनीकी विश्लेषण, सोमवार 27 मार्च 2023।

अगर हम USD इंडेक्स के डेली चार्ट पर नजर डालें तो कुछ दिलचस्प बातें सामने आएंगी: 1. बहुत बढ़िया ऑसिलेटर सूचक के साथ मूल्य आंदोलन के बीच एक विचलन है।

Arief Makmur 09:34 2023-03-27 UTC+2

GBP/USD: 24 मार्च, 2023 को तकनीकी विश्लेषण। BoE ने 11वीं बार दरें बढ़ाईं

नमस्कार प्रिय व्यापारियों! 1-घंटे के चार्ट पर, GBP/USD ने 1.2342 का बाउंस किया, नीचे की ओर पलट गया, और 1.2238 की ओर बढ़ गया और आरोही कॉरिडोर की निचली सीमा।

Samir Klishi 12:26 2023-03-24 UTC+2

17 मार्च, 2023 को EUR/USD के लिए पूर्वानुमान

EUR/USD जोड़ी गुरुवार को ऊपर जा रही थी और 161.8% सुधारात्मक स्तर (1.0609) से ऊपर जाने में सक्षम थी। प्रति घंटा और 4-घंटे के चार्ट दिखाते हैं कि जोड़ी लंबे

Samir Klishi 17:53 2023-03-17 UTC+2

9 मार्च, 2023 के लिए USDJPY पर तकनीकी विश्लेषण।

USDJPY 136-136.20 के आसपास कारोबार कर रहा है। मूल्य आज एक नया मंदी संकेत प्रदान करते हुए अल्पकालिक ऊपर की ओर झुकी हुई प्रवृत्ति रेखा से नीचे टूट गया। बुल्स

Alexandros Yfantis 18:05 2023-03-09 UTC+2

यूएसडी/सीएडी कमोडिटी करेंसी पेअर के दैनिक मूल्य उतार-चढ़ाव का तकनीकी विश्लेषण, बुधवार, 08 मार्च 2023।

दैनिक चार्ट USD/CAD कमोडिटी मुद्रा पेअर पर कुछ दिलचस्प बातें हैं: 1. तीन ऋषि संकेत की उपस्थिति। 2. बहुत बढ़िया ऑसिलेटर इंडिकेटर के साथ प्राइस मूवमेंट के बीच एक विचलन

Arief Makmur 07:51 2023-03-08 UTC+2

GBP/CHF, H4 | प्रमुख समर्थन से संभावित उछाल?

मूल्य 1.1246 पर एक प्रमुख समर्थन स्तर का परीक्षण कर रहा है जो 38.2% फाइबोनैचि रिट्रेसमेंट के साथ एक ओवरलैप समर्थन है। यहां से उछाल आने पर कीमतें 1.1356

Dean Leo 18:23 2023-03-02 UTC+2

2 मार्च, 2023 को सोने पर इचिमोकू क्लाउड इंडिकेटर विश्लेषण।

सोना 1,836 डॉलर के आसपास कारोबार कर रहा है। इचिमोकू क्लाउड के संदर्भ में 4 घंटे का चार्ट सोने को तटस्थ प्रवृत्ति में दिखाता है क्योंकि कीमत कुमो (क्लाउड) के

Alexandros Yfantis 18:23 2023-03-02 UTC+2

क्रूड ऑयल कमोडिटी एसेट के साप्ताहिक मूल्य उतार-चढ़ाव का तकनीकी विश्लेषण, सोमवार 27 फरवरी 2023

साप्ताहिक चार्ट पर, क्रूड ऑयल कमोडिटी एसेट अपने मूल्य आंदोलनों और स्टोचैस्टिक ऑसिलेटर इंडिकेटर के बीच छिपे हुए अंतर को दर्शाता है। इसका मतलब है कि निकट भविष्य में #CL

Arief Makmur 18:10 2023-02-27 UTC+2
अभी बात नहीं कर सकते?
अपना प्रश्न पूछें बातचीत.