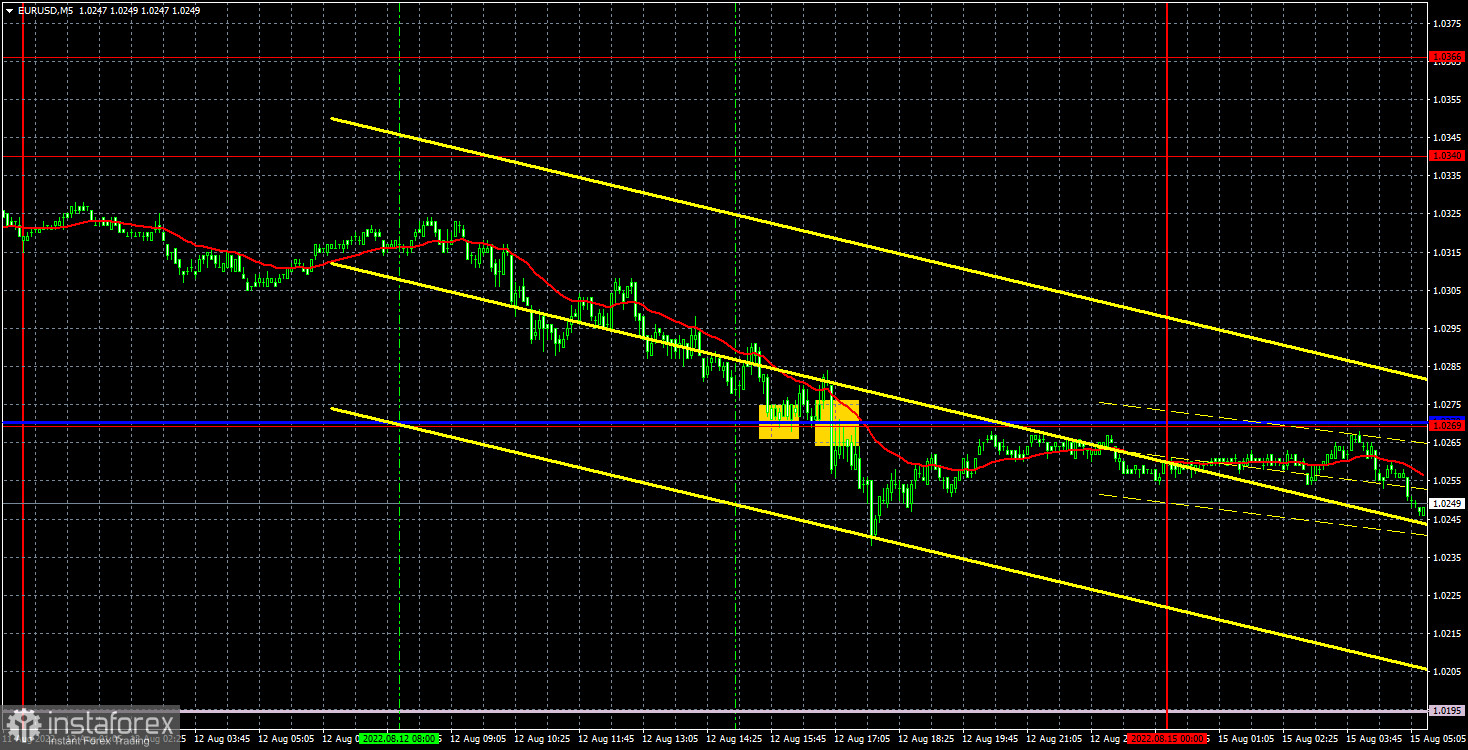
EUR/USD 5M
The EUR/USD pair did not even try to continue growing last Friday. Recall that it all started last Wednesday, when it became known about the decline in inflation in the United States. New forecasts immediately began to be built on this basis, various conjectures were made that had no basis. The most common version was the easing of the Federal Reserve's monetary approach, as a result of which the rate would almost stop increasing. However, we said from the very beginning that the Fed is raising rates anyway and will continue to do so for several more months. Therefore, to say that the US dollar will now fall because the Fed is raising rates too slowly would be simply stupid. Actually, the market seems to have started counting in the same way very quickly, because by the close of last week the dollar had recouped almost all of its losses. Well, namely on Friday, a report on industrial production was published in the European Union, which no one was interested in.
There were few trading signals on Friday. I had to skip most of the downward movement, since at the very beginning of it, the quotes never met with any important line or level. It must be admitted that the movement itself was almost perfect, since the pair moved only in one direction all day and did it quite calmly. However, the first signal was formed only near the Kijun-sen line and immediately turned out to be false. The price initially rebounded from this line, but after half an hour it overcame it. Moreover, the second signal was already formed quite late, but one could still try to work it out, and it could bring a dozen points of profit. Thus, the day as a whole ended in a small loss.
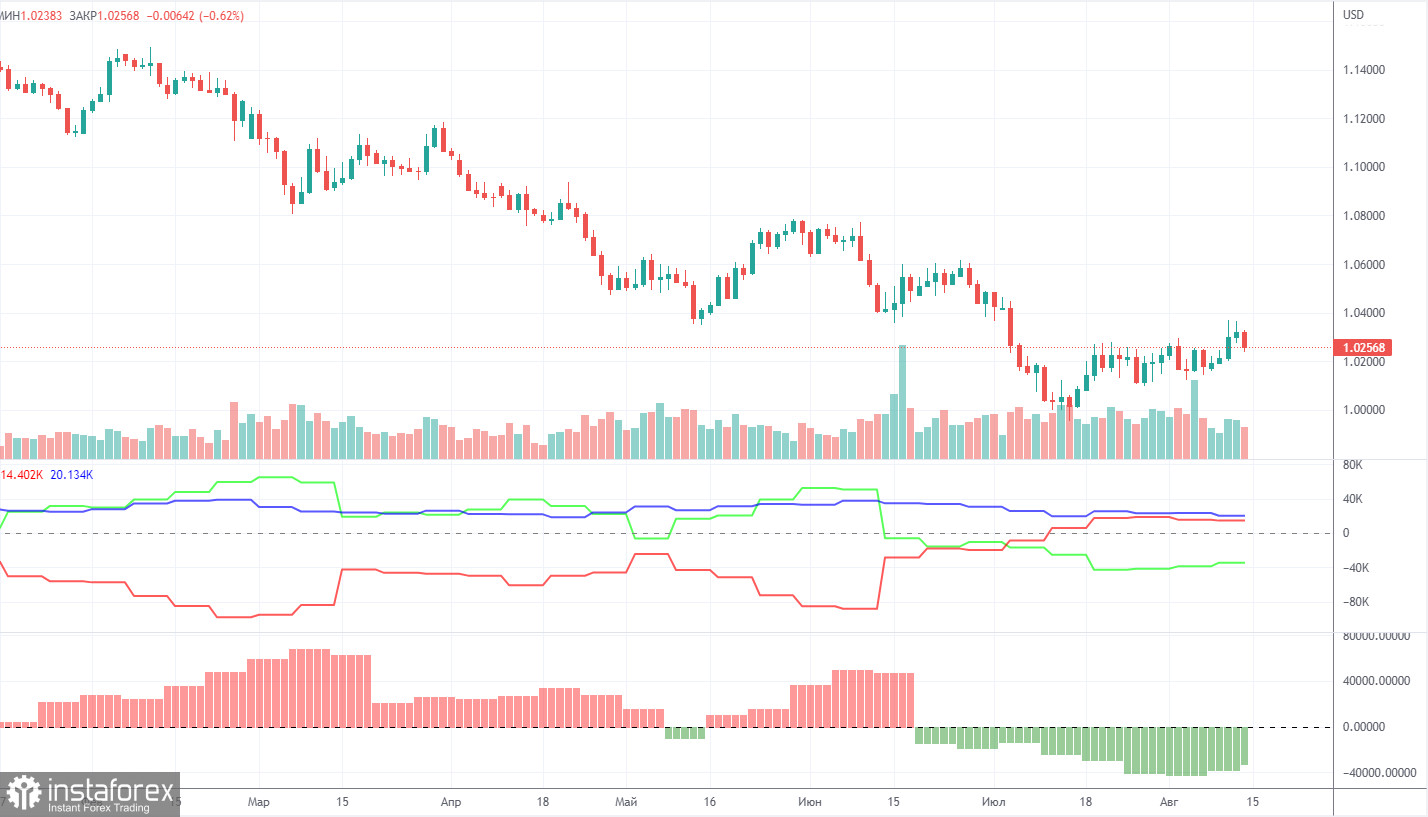
COT report:
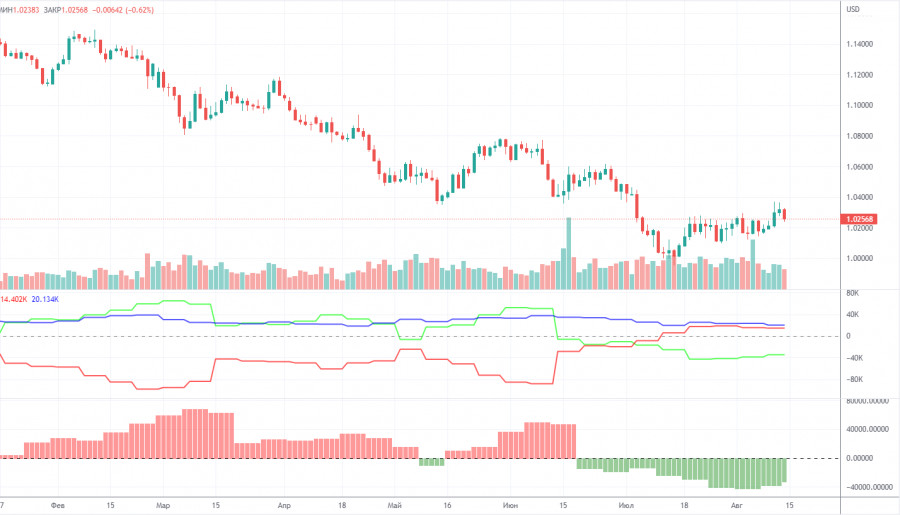
The Commitment of Traders (COT) reports on the euro over the past six months have raised a huge number of questions. The chart above clearly shows that for most of 2022 they showed an open bullish mood of professional players, but at the same time, the euro fell steadily at the same time. At this time, the situation has changed, but NOT in favor of the euro. If earlier the mood was bullish, and the euro was falling, now the mood is bearish and... the euro is also falling. Therefore, for the time being, we do not see any grounds for the euro's growth, because the vast majority of factors remain against it. During the reporting week, the number of long positions for the non-commercial group increased by 8,400, and the number of shorts - by 4,100. Accordingly, the net position increased by about 4,000 contracts, which is a negligible change for the euro. The mood of major players remains bearish. From our point of view, this fact very eloquently indicates that at this time even commercial traders still do not believe in the euro. The number of longs is lower than the number of shorts for non-commercial traders by 35,000. Therefore, we can state that not only the demand for the US dollar remains high, but also the demand for the euro is quite low. The fact that major players are in no hurry to buy the euro may lead to a new, even greater fall. The euro has not been able to show even a tangible correction over the past six months or a year, not to mention something more. The highest upward movement was about 400 points. The pair has just managed to correct by 400 points over the past four weeks. Has the plan been completed?
We recommend to familiarize yourself with:
Forecast and trading signals for GBP/USD on August 15. Detailed analysis of the movement of the pair and trading transactions.
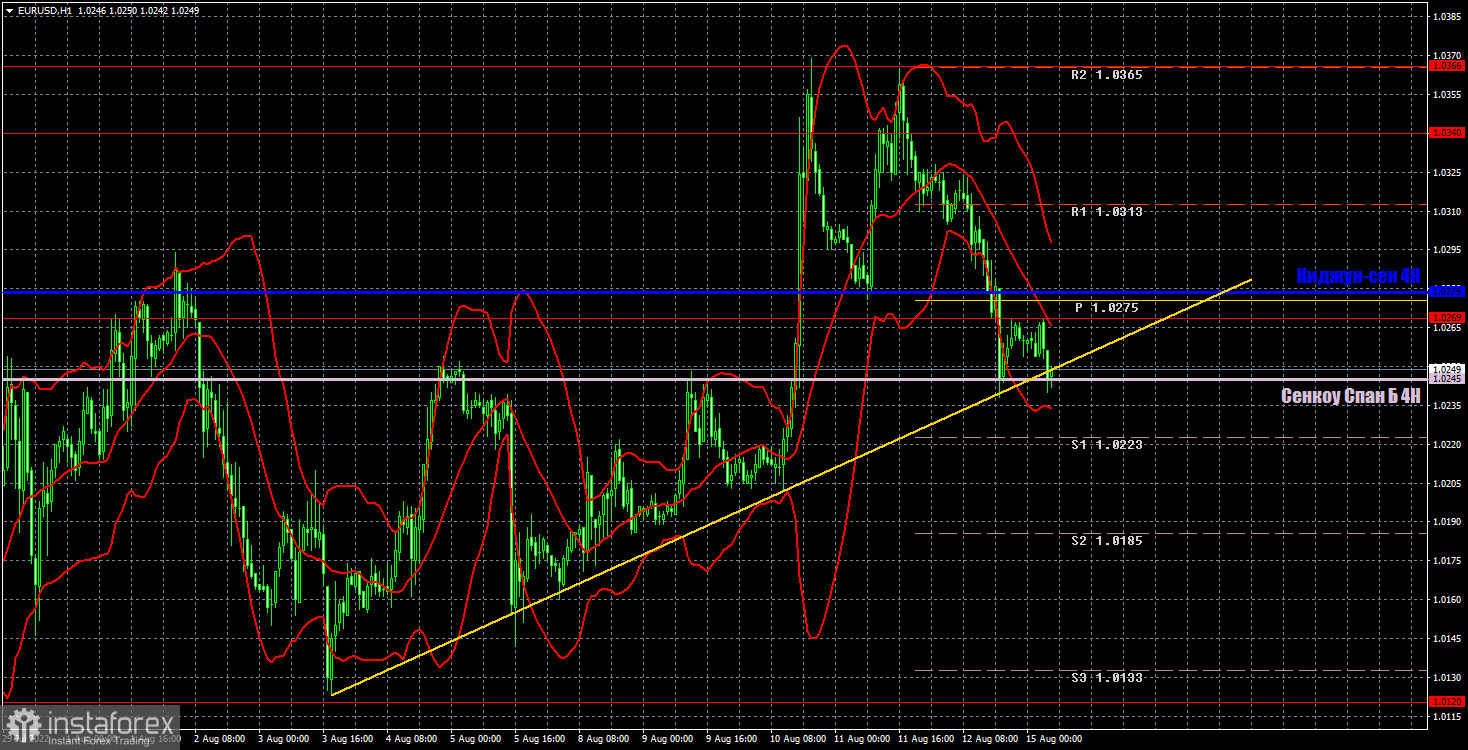
EUR/USD 1H
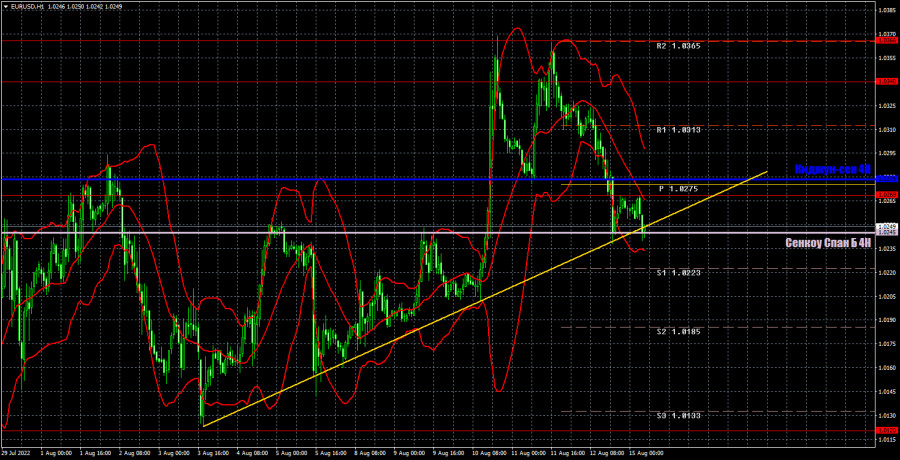
The pair finally broke out of the horizontal channel 1.0120-1.0269 and even formed an upward trend on the hourly timeframe, which can officially end today. The trend line is still relevant, as it has not yet been possible to settle below it and the Senkou Span B line. Rebounds from these lines can still provoke the resumption of the upward movement. Overcoming the line Senkou Span B with a probability of 90% will mean the resumption of the global downward trend. We highlight the following levels for trading on Monday - 1.0120, 1.0269, 1.0340-1.0366, 1.0485, 1.0579, as well as Senkou Span B (1.0245) and Kijun-sen (1 .0279). Ichimoku indicator lines can move during the day, which should be taken into account when determining trading signals. There are also secondary support and resistance levels, but no signals are formed near them. Signals can be "rebounds" and "breakthrough" extreme levels and lines. Do not forget about placing a Stop Loss order at breakeven if the price has gone in the right direction for 15 points. This will protect you against possible losses if the signal turns out to be false. Not a single important report will be published in the European Union and the US on August 15, as often happens on Mondays. Thus, the pair's movements can be quite calm and non-volatile.
Explanations for the chart:
Support and Resistance Levels are the levels that serve as targets when buying or selling the pair. You can place Take Profit near these levels.
Kijun-sen and Senkou Span B lines are lines of the Ichimoku indicator transferred to the hourly timeframe from the 4-hour one.
Support and resistance areas are areas from which the price has repeatedly rebounded off.
Yellow lines are trend lines, trend channels and any other technical patterns.
Indicator 1 on the COT charts is the size of the net position of each category of traders.
Indicator 2 on the COT charts is the size of the net position for the non-commercial group.