Analyzing Monday's trades:
GBP/USD on 30M chart
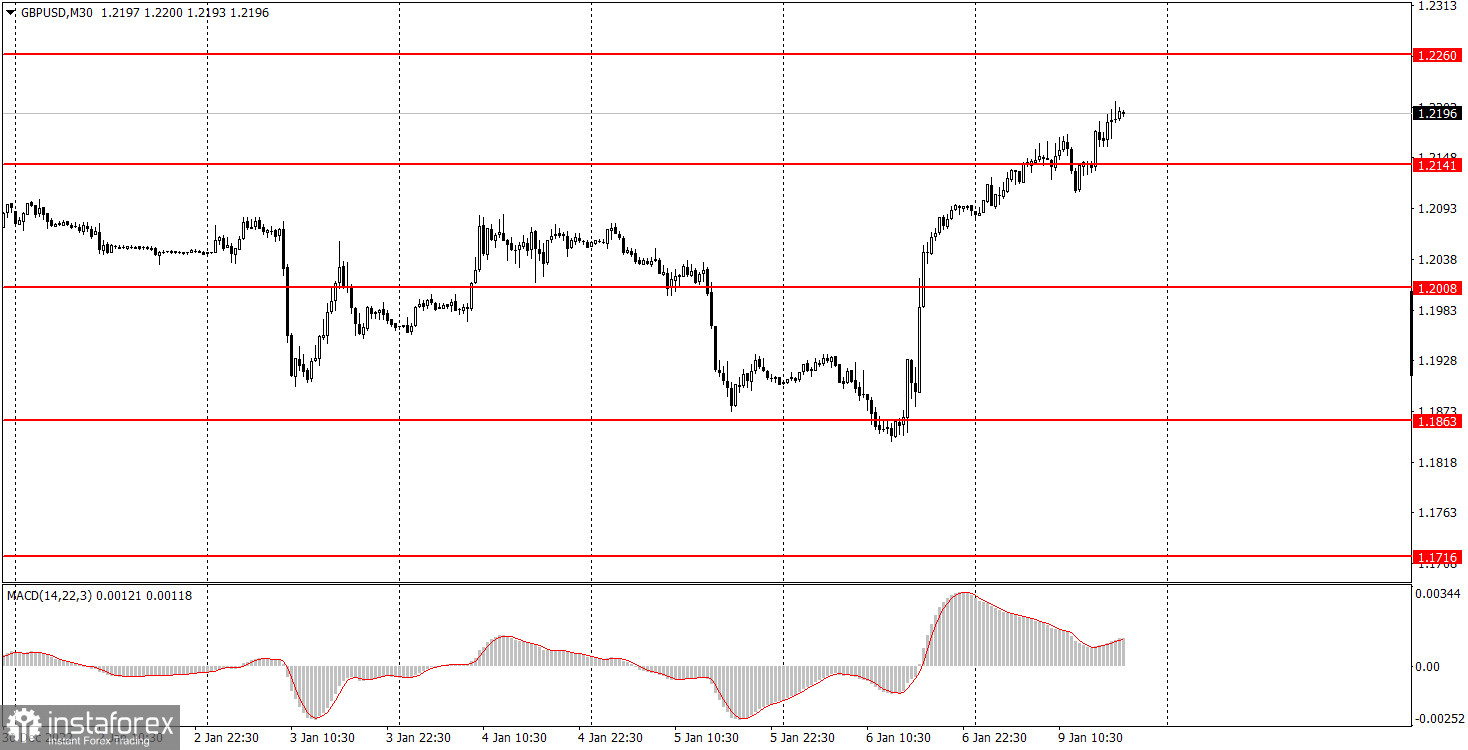
GBP/USD traded identically to the EUR/USD pair on Monday. There were similar movements on Friday as well because most of the important macro data came from overseas. Accordingly, they had the same effect on both major pairs. I have already mentioned that the market's reaction to Friday's US data was absolutely illogical. Firstly, the market simply ignored the fact that unemployment was falling. Secondly, the market did not think that the Nonfarm report was strong enough. Thirdly, the market has paid too much attention to the ISM report. The ISM non-manufacturing PMI is certainly important, but it isn't more important than Nonfarm and unemployment. In general, we have become a bit weary of traders buying the euro and the pound for no reason, now we are reminded of it again. I still believe that the British currency has grown too much and does not deserve to rise again. In addition, there are still few reasons for the pound to grow.
GBP/USD on M5 chart
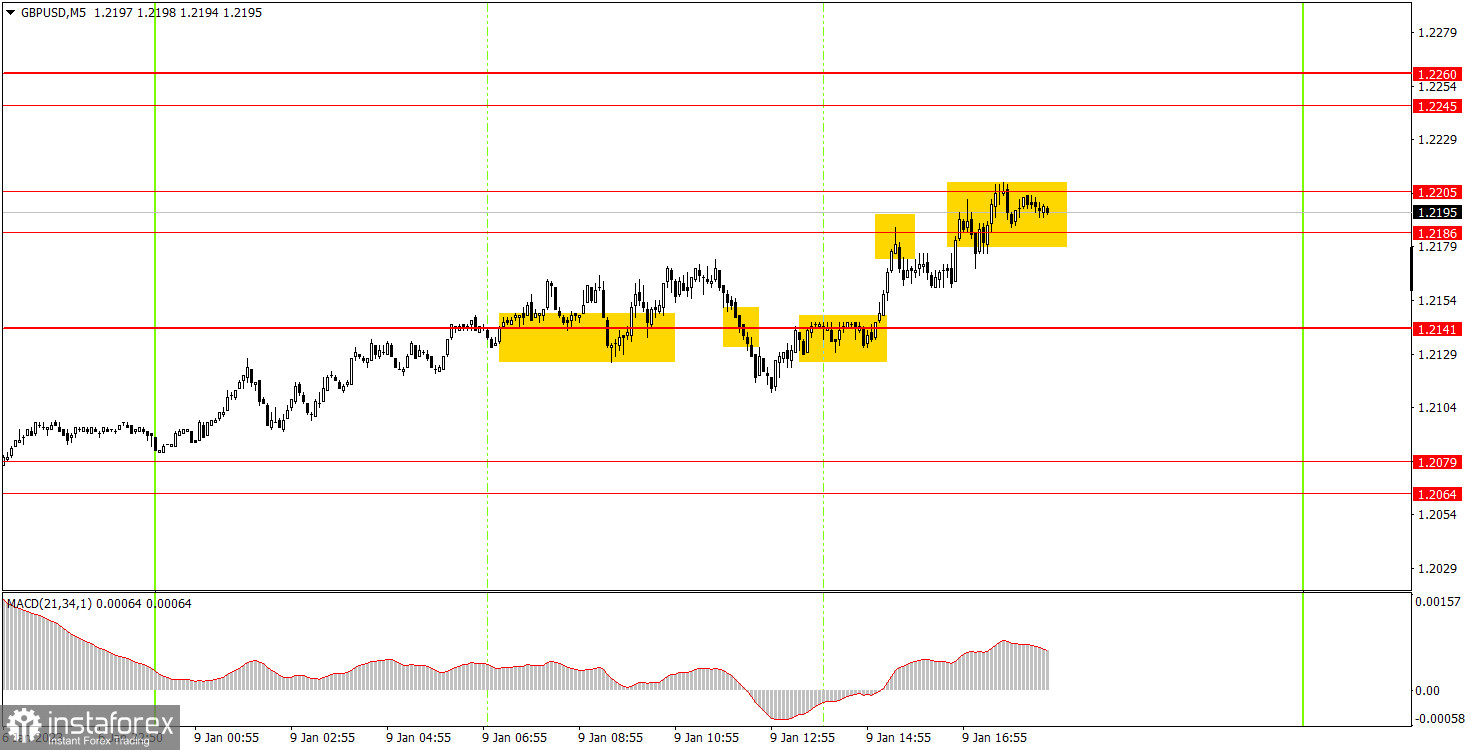
On the 5-minute chart, the upward slope of the movement remained on Monday, but at the same time, the pair moved sideways more often than it did upwards. A lot of signals were formed since there were quite a lot of levels in the price area where the pair was at. At the same time, since there was no strong trend movement, the signals were mostly false. Therefore, novice traders could try to use the first two signals near 1.2141 and a rebound from 1.2186. In each of these three cases, the price could not even go in the right direction by 20 points, so each transaction closed with a loss. It doesn't happen often, but it does happen. The day turned out to be quite unsuccessful.
Trading tips on Tuesday:
On the 30-minute chart, the pound/dollar pair began to rise again last Friday, which does not correspond at all to the macroeconomic background that traders could use. Therefore, I don't think that the pair's current growth is logical and am waiting for a new round of decline. Also, the market may realize that the dollar's fall on Friday was unfair and they could start buying it for no apparent reason. On the 5-minute chart, it is recommended to trade at the levels 1.1950-1.1957, 1.2008, 1.2057-1.2079, 1.2141, 1.2186-1.2205, 1.2245-1.2260, 1.2337-1.2343, 1.2371. As soon as the price passes 20 pips in the right direction, you should set a Stop Loss to breakeven. There are no major events scheduled for Tuesday in the UK, and Federal Reserve Jerome Powell's speech will take place in the US. Thus, Tuesday's movements may be strong and there could be a trend again.
Basic rules of the trading system:
1) The strength of the signal is determined by the time it took the signal to form (a rebound or a breakout of the level). The quicker it is formed, the stronger the signal is.
2) If two or more positions were opened near a certain level based on a false signal (which did not trigger a Take Profit or test the nearest target level), then all subsequent signals at this level should be ignored.
3) When trading flat, a pair can form multiple false signals or not form them at all. In any case, it is better to stop trading at the first sign of a flat movement.
4) Trades should be opened in the period between the start of the European session and the middle of the US trading hours when all positions must be closed manually.
5) You can trade using signals from the MACD indicator on the 30-minute time frame only amid strong volatility and a clear trend that should be confirmed by a trendline or a trend channel.
6) If two levels are located too close to each other (from 5 to 15 pips), they should be considered support and resistance levels.
On the chart:
Support and Resistance levels are the levels that serve as targets when buying or selling the pair. You can place Take Profit near these levels.
Red lines are channels or trend lines that display the current trend and show in which direction it is better to trade now.
The MACD indicator (14, 22, and 3) consists of a histogram and a signal line. When they cross, this is a signal to enter the market. It is recommended to use this indicator in combination with trend patterns (channels and trendlines).
Important announcements and economic reports that can be found on the economic calendar can seriously influence the trajectory of a currency pair. Therefore, at the time of their release, we recommend trading as carefully as possible or exiting the market in order to avoid sharp price fluctuations.
Beginners on Forex should remember that not every single trade has to be profitable. The development of a clear strategy and money management is the key to success in trading over a long period of time.