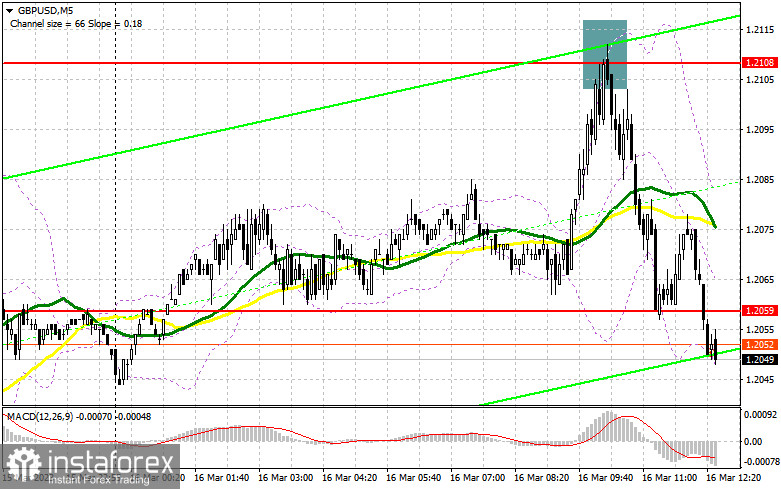
I focused on the level of 1.2108 when I made my morning forecast and suggested trading actions based on it. Let's take a look at the 5-minute chart and see what happened. A sell signal was formed for the pound as a result of the development and formation of a false collapse at this level, which caused the pair to decline by more than 60 points. The technical situation has not changed for the second half of the day.
You require the following to open long positions on the GBP/USD:
Undoubtedly, all attention will now be focused on the US labor market and real estate statistics. Statistics on the number of initial applications for unemployment benefits, the volume of issued building permits, and the number of new foundations laid are also anticipated. The desire for the dollar will revive with good indicators. The US dollar will undoubtedly be supported by a significant increase in the Fed-Philadelphia manufacturing index, putting additional pressure on the GBP/USD pair. If the pound continues to fall and adjusts, only the development of a false collapse on 1.2013 will enable it to receive a buy signal to recover to 1.2059, which purchasers missed in the morning. While fixing and testing this range from top to bottom against the backdrop of traders' optimistic reaction to disappointing US data, I bet on more active GBP/USD growth and a repeated resistance test of 1.2108, which could not be broken above in European auctions. I also buy there only after a breakout with the possibility of further growth at 1.2158, where I set my profit. The pair will continue to decline if the bulls are unable to complete the tasks assigned to them and miss 1.2013 in the afternoon. This will finally result in the emergence of a new bearish trend. In this instance, I recommend that you do not rush into purchases and instead wait for a false collapse to open long positions around the next support level of 1.1970. I'll buy the GBP/USD pair right now only if it recovers from the low of 1.1927 with the intention of a 30- to 35-point correction during the day.
For opening short positions on the GBP/USD, you will need:
Strong data on the labor market and real estate market in the US will be used by sellers of the pound to offset the strengthening of the US currency. In the area of the closest resistance level of 1.2059, which the bulls missed, I see a rebound and the development of a false breakout as the best-case scenario for selling during the American session today. This will be an excellent signal to begin short positions to decrease GBP/USD by 1.2013, where buyers will already be demonstrating their resistance to the continuation of the bearish correction. Strong US economic data will put pressure on the pair, and if it breaks out and reverses tests from the bottom up of this range, a sell signal will be formed with a drop to 1.1970. The distance to the target, where I will fix the profit, is still at least 1.1927. Only a false breakout in the area of the next resistance level of 1.2108, from which the pound has already fallen in the morning, will provide an entry point into short positions given the possibility of GBP/USD growth and the absence of bears at 1.2059 in the afternoon. In the absence of action, I will sell GBP/USD immediately from the high of 1.2158, but only if the pair falls by 30-35 points within the day.
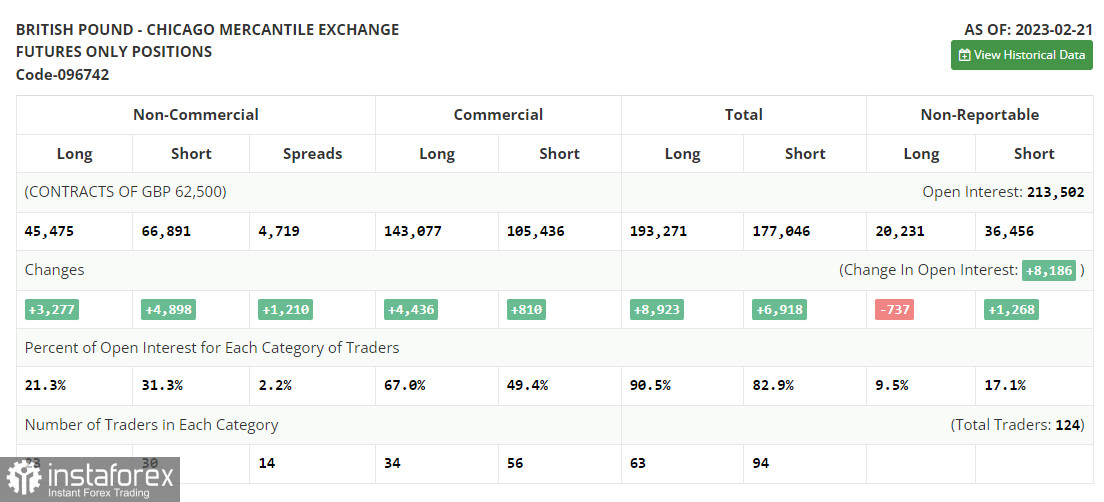
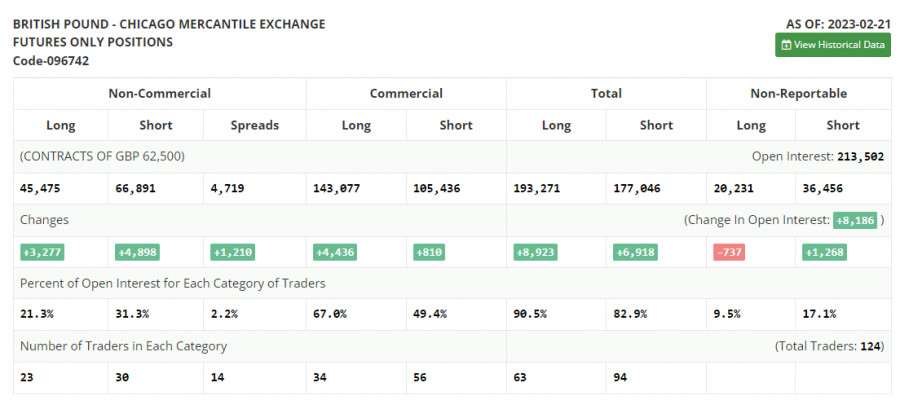
Both long and short positions rose in the COT report (Commitment of Traders) for February 21. It should be clear that these data are of no interest at the moment because, in the CFTC cyberattack, statistics are only now starting to catch up, making the data from one month ago less useful. I'll hold off until new reports are released and rely on more recent data. Important events this week are predicted to yield statistics on the UK labor market and the growth of average earnings, which will help the Bank of England in determining future interest rates against the backdrop of stable inflation. The increase in household income could maintain the high rate of inflation. We are also awaiting statistics on US inflation, which might ultimately increase traders' confidence that the Fed and Jerome Powell won't resume their course of strict policy, as was suggested last week. The prospect of the US banking industry collapsing, which emerged during the BSV bankruptcy, would undoubtedly alter Fed policymakers' assessments of how much more they need to raise the rate to "finish off" the economy. According to the most recent COT data, long non-commercial positions increased by 4,898 to 66,891 while short non-commercial positions increased by 3,277 to 45,475. As a result, the non-commercial net position's negative value increased to -21,416 from -19,795 a week earlier. The weekly ending price fell from 1.2181 to 1.2112 this week.
Signals from indicators
Moving Averages
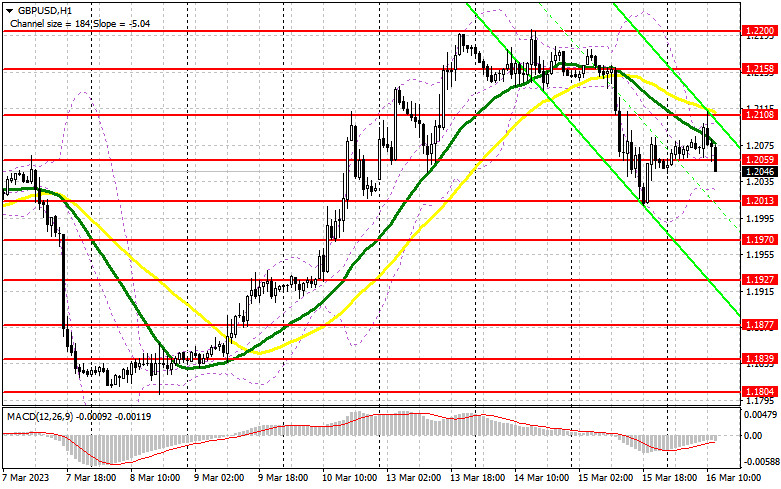
Trade is taking place below the 30- and 50-day moving averages, which suggests that a downward correction is likely.
Notably, the author considers the time and prices of moving averages on the hourly chart H1 and differs from the standard definition of the traditional daily moving averages on the daily chart D1.
Bands by Bollinger
The indicator's upper limit, which is located at 1.2095, will serve as resistance in the event of growth.
Description of indicators
- Moving average (moving average determines the current trend by smoothing out volatility and noise). Period 50. The graph is marked in yellow.
- Moving average (moving average determines the current trend by smoothing out volatility and noise). Period 30. The graph is marked in green.
- MACD indicator (Moving Average Convergence / Divergence - moving average convergence/divergence) Fast EMA period 12. Slow EMA period 26. SMA period 9
- Bollinger Bands (Bollinger Bands). Period 20
- Non-profit speculative traders, such as individual traders, hedge funds, and large institutions use the futures market for speculative purposes and to meet certain requirements.
- Long non-commercial positions represent the total long open position of non-commercial traders.
- Short non-commercial positions represent the total short open position of non-commercial traders.
- Total non-commercial net position is the difference between the short and long positions of non-commercial traders.