Analyzing Monday's trades:
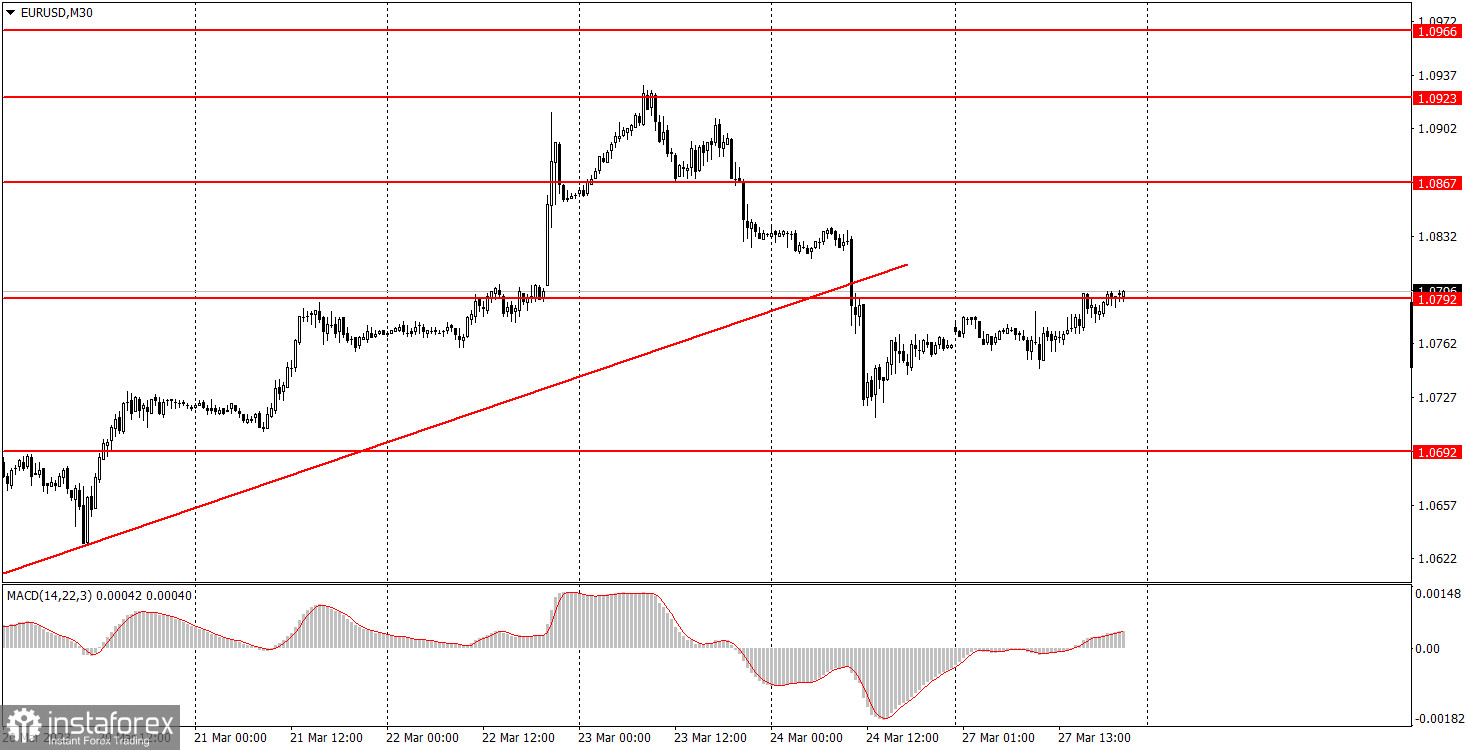
EUR/USD on 30M chart
On Monday, EUR/USD started to correct after a two-day decline at the end of last week. Let me remind you (and it's perfectly visible in the chart above), that the price has settled below the ascending trend line, so, according to the idea, the euro should continue to fall. On Monday, there were no important macro data or fundamental events either in the US or in the EU and volatility was bad - just 50 pips. With such volatility, it was very difficult to expect good moves and profitable trading signals. That's why, just like before, I expect the euro to fall. This week there will be very few important events, and in the first three days there will be none. Therefore, low volatility and unclear movements may persist.
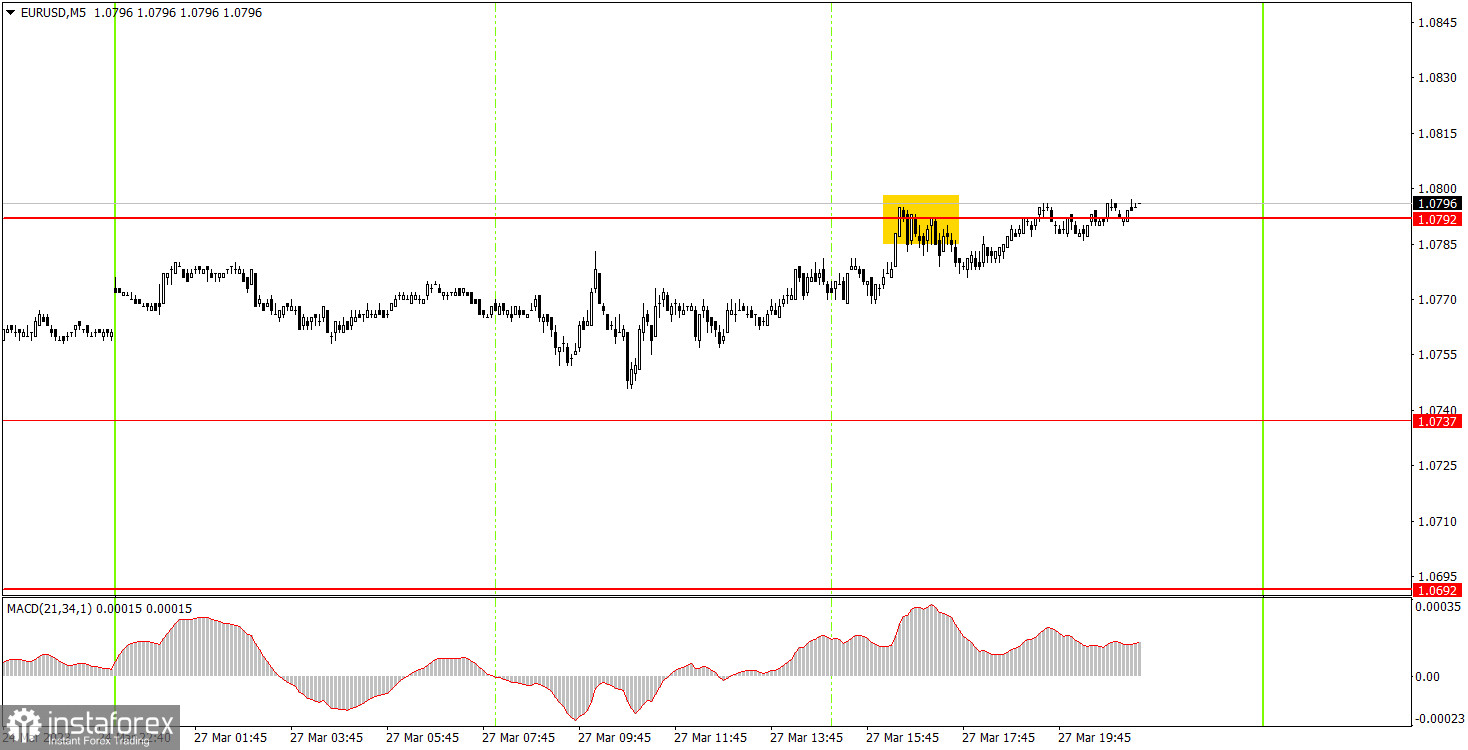
EUR/USD on 5M chart
The 5-minute chart also shows exactly how the pair traded during the day. It is very fortunate that there was only one trading signal, because with almost flat movement there could have been many more, and all of them would have been false. And in this case, the price rebounded only once from 1.0792, which was a false signal, but till the end of the day, the pair failed to rise above 1.0792. Therefore, beginners had enough time to leave the short position with a minimum loss of just a few pips. Once again, let me remind you that when there is no trend and no volatility, it is very difficult to make profits. It's not even about the signals and their quality, it's about the lack of movement, which can even theoretically bring profit.
Trading tips on Tuesday:
On the 30-minute chart, the pair has finished forming an uptrend, and now it might fall, which is what we're waiting for. I believe that the euro has exhausted its growth potential, and it rose even more than it was justified by the fundamental and macroeconomic background. The euro does have a few reasons to rise (and we will speak about them in our fundamental articles), but now we have a sell signal and it is necessary for the single currency to correct. On the 5-minute chart, it is recommended to trade at the levels 1.0465-1.0483, 1.0535, 1.0587-1.0607, 1.0692, 1.0737, 1.0792, 1.0857-1.0867, 1.0920-1.0933, 1.0966, 1.0989. As soon as the price passes 15 pips in the right direction, you should set a Stop Loss to breakeven. There are no important events planned in the EU and America on Tuesday again, so the movement during the day may be weak and there will be no trend.
Basic rules of the trading system:
1) The strength of the signal is determined by the time it took the signal to form (a rebound or a breakout of the level). The quicker it is formed, the stronger the signal is.
2) If two or more positions were opened near a certain level based on a false signal (which did not trigger a Take Profit or test the nearest target level), then all subsequent signals at this level should be ignored.
3) When trading flat, a pair can form multiple false signals or not form them at all. In any case, it is better to stop trading at the first sign of a flat movement.
4) Trades should be opened in the period between the start of the European session and the middle of the US trading hours when all positions must be closed manually.
5) You can trade using signals from the MACD indicator on the 30-minute time frame only amid strong volatility and a clear trend that should be confirmed by a trendline or a trend channel.
6) If two levels are located too close to each other (from 5 to 15 pips), they should be considered support and resistance levels.
On the chart:
Support and Resistance levels are the levels that serve as targets when buying or selling the pair. You can place Take Profit near these levels.
Red lines are channels or trend lines that display the current trend and show in which direction it is better to trade now.
The MACD indicator (14, 22, and 3) consists of a histogram and a signal line. When they cross, this is a signal to enter the market. It is recommended to use this indicator in combination with trend patterns (channels and trendlines).
Important announcements and economic reports that can be found on the economic calendar can seriously influence the trajectory of a currency pair. Therefore, at the time of their release, we recommend trading as carefully as possible or exiting the market in order to avoid sharp price fluctuations.
Beginners on Forex should remember that not every single trade has to be profitable. The development of a clear strategy and money management is the key to success in trading over a long period of time.