Analyzing Tuesday's trades:
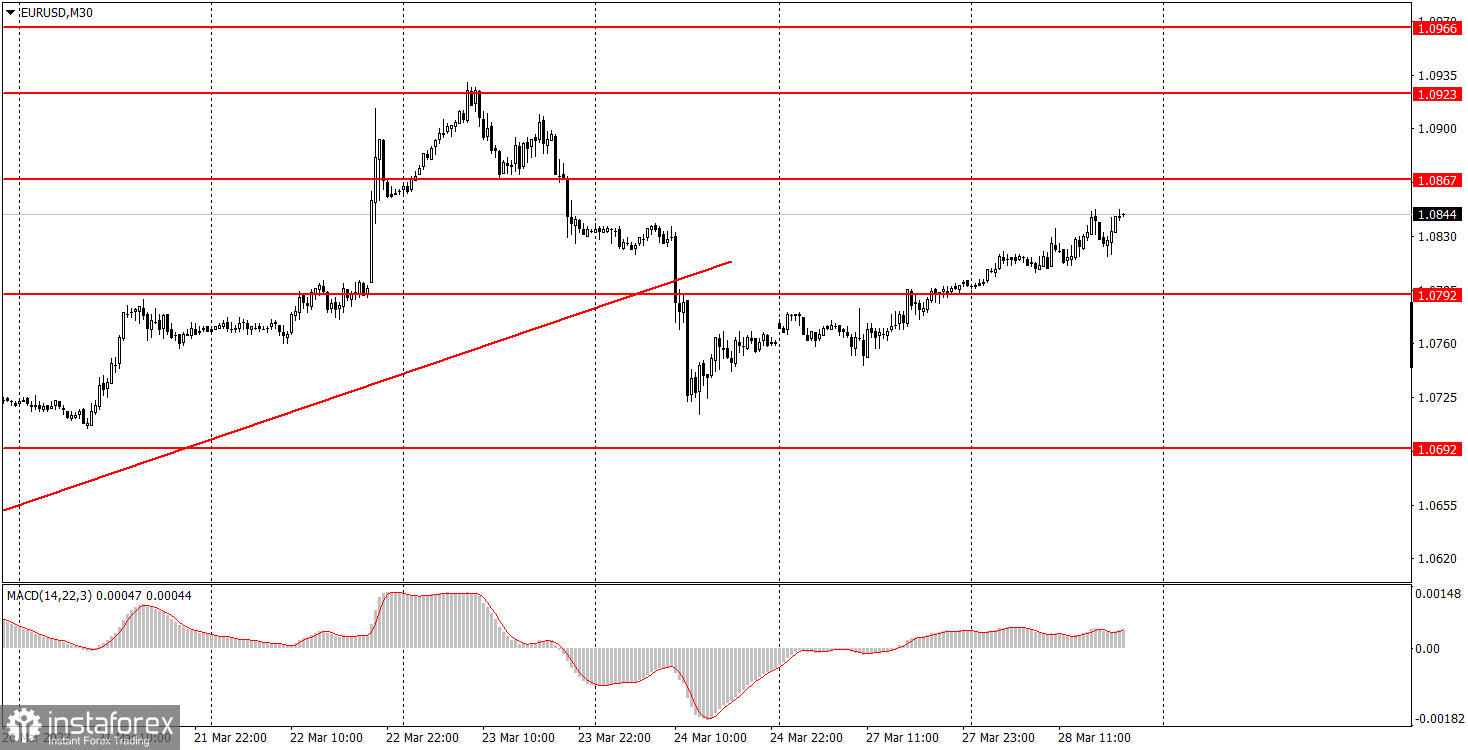
EUR/USD on 30M chart
The EUR/USD currency pair continued to correct on Tuesday after a two-day decline at the end of last week. The pair completely ignored a strong sell signal when it broke through the ascending trend line. A fall would be more logical now, but the first two days of the week gave us a good idea of which direction most of the market participants are looking in. Although there aren't any macroeconomic and fundamental information right now, the euro still moves in one direction. Of course, if you really want a reason, you can "find" the necessary news to justify the movement. For instance, in the last few days, some experts and Federal Reserve representatives hinted at the possible end of the monetary policy easing cycle in the US either vaguely or openly. Maybe this is why the dollar is falling right now. But such a conclusion is not obvious.
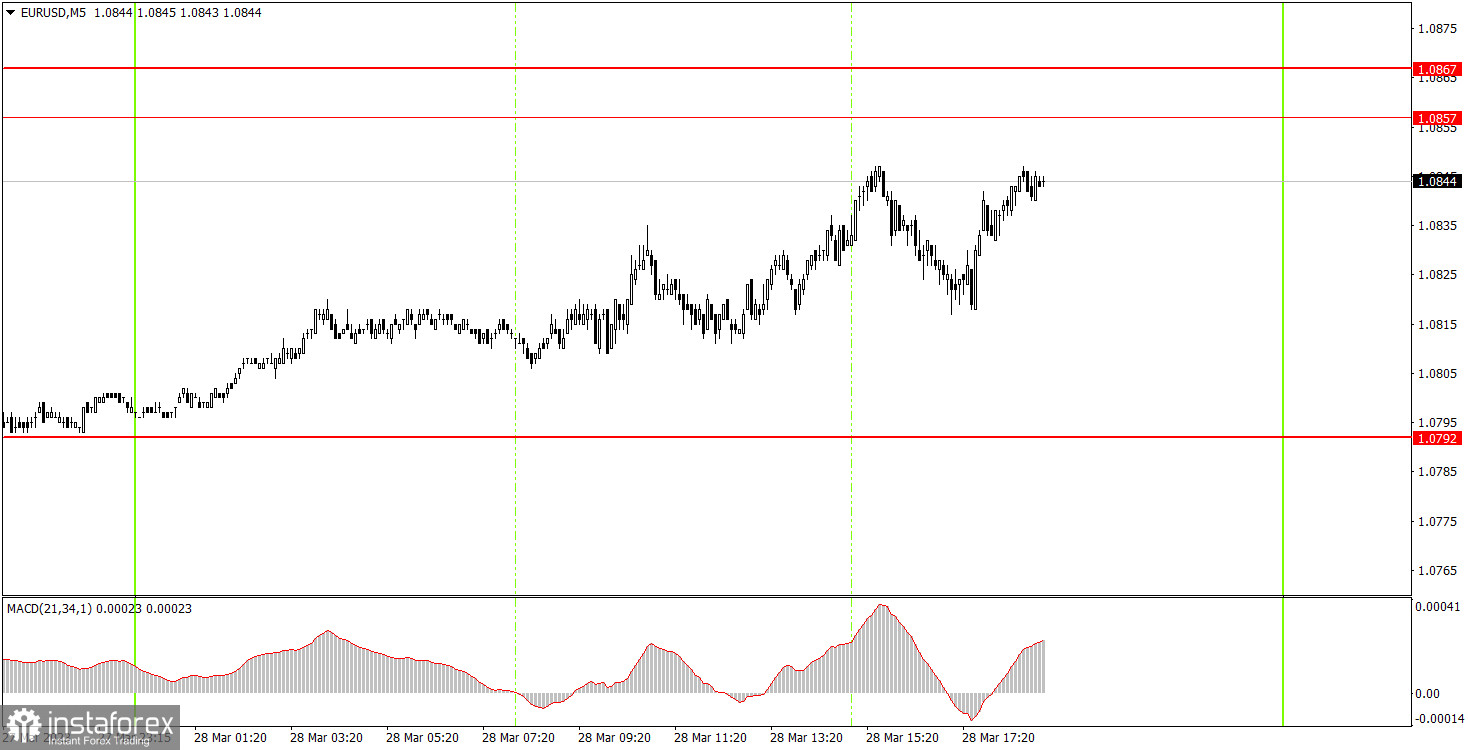
EUR/USD on 5M chart
On the 5-minute chart, you can see that the pair was just gradually moving during the day. Despite the fact that the price has been moving in the same direction for two days, volatility was 50 points on Tuesday, which is about the same as Monday. Therefore, it is quite difficult to expect trading signals and hit target levels. In addition, the movement is ragged and the pair often rolls back down, which may lead to false signals. Therefore, it's also a good thing that there were no signals as they could have potentially brought huge losses to beginners.
Trading tips on Wednesday:
On the 30-minute chart, the pair has finished forming an uptrend, and now it might fall, which is what we're waiting for. I believe that the euro has exhausted its growth potential, and it rose even more than it was justified by the fundamental and macroeconomic background. The euro does have a few reasons to rise (and we will speak about them in our fundamental articles), but now we have a sell signal and it is necessary for the single currency to correct. But then the market completely ignores all the signals and reasons and just continues to open long positions. On the 5-minute chart, it is recommended to trade at the levels 1.0465-1.0483, 1.0535, 1.0587-1.0607, 1.0692, 1.0737, 1.0792, 1.0857-1.0867, 1.0920-1.0933, 1.0966, 1.0989. As soon as the price passes 15 pips in the right direction, you should set a Stop Loss to breakeven. There are no important events planned in the EU and America on Wednesday, so the movement might be weak and jagged again.
Basic rules of the trading system:
1) The strength of the signal is determined by the time it took the signal to form (a rebound or a breakout of the level). The quicker it is formed, the stronger the signal is.
2) If two or more positions were opened near a certain level based on a false signal (which did not trigger a Take Profit or test the nearest target level), then all subsequent signals at this level should be ignored.
3) When trading flat, a pair can form multiple false signals or not form them at all. In any case, it is better to stop trading at the first sign of a flat movement.
4) Trades should be opened in the period between the start of the European session and the middle of the US trading hours when all positions must be closed manually.
5) You can trade using signals from the MACD indicator on the 30-minute time frame only amid strong volatility and a clear trend that should be confirmed by a trendline or a trend channel.
6) If two levels are located too close to each other (from 5 to 15 pips), they should be considered support and resistance levels.
On the chart:
Support and Resistance levels are the levels that serve as targets when buying or selling the pair. You can place Take Profit near these levels.
Red lines are channels or trend lines that display the current trend and show in which direction it is better to trade now.
The MACD indicator (14, 22, and 3) consists of a histogram and a signal line. When they cross, this is a signal to enter the market. It is recommended to use this indicator in combination with trend patterns (channels and trendlines).
Important announcements and economic reports that can be found on the economic calendar can seriously influence the trajectory of a currency pair. Therefore, at the time of their release, we recommend trading as carefully as possible or exiting the market in order to avoid sharp price fluctuations.
Beginners on Forex should remember that not every single trade has to be profitable. The development of a clear strategy and money management is the key to success in trading over a long period of time.