Analysis of EUR/USD on 5M chart
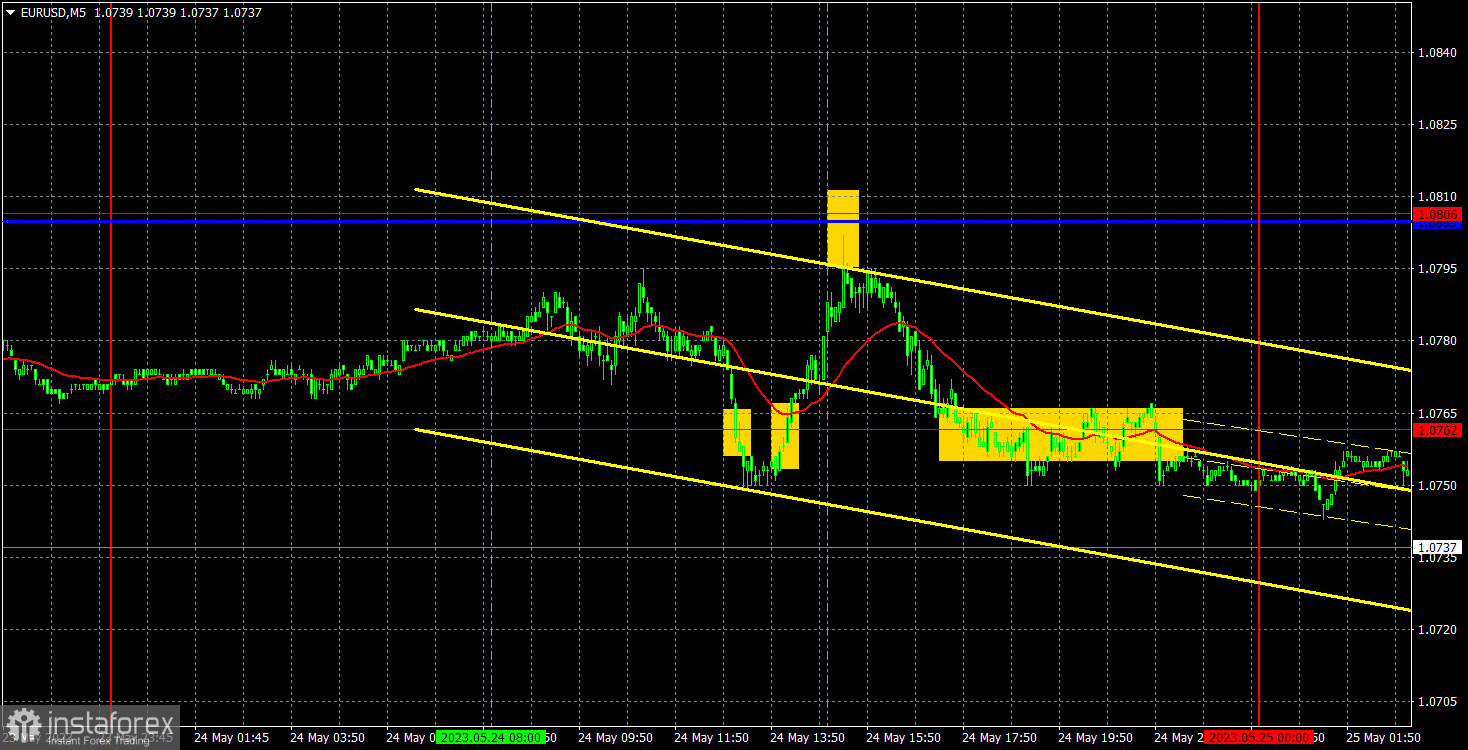
The EUR/USD pair was mainly in the downward range on Wednesday. Its movements were quite sluggish. The pair rebound to the high but later resumed its downward movement. Despite a steady decline, it is quite hard to predict the movements of the pair as the downward movement is very weak. In fact, the pair drops every day by 20-25 pips on average. However, it also rises every day. Thus, medium-term trading without the help of indicators is now preferable. The Fed minutes and Christine Lagarde's speech did not spur volatility in the market. Market participants paid zero attention to these events. Yesterday, no crucial economic reports were published.
The first sell signal turned out to be false. The pair consolidated below the 1.0762 level but failed to go down even by 15 pips. So, the trade was closed with small losses. After consolidation above the 1.0762 level, traders could have opened long positions, which had already brought them profit. The pair broke through the Kijun-sen line with a 3-pip difference from my forecast. Speculators should have opened short positions after a rebound from this level. The euro managed to go down to 1.0762 before the evening. Therefore, the last two transactions turned out to be profitable, but the profit was not high. However, it helped recoup losses from the first transaction.
COT report:
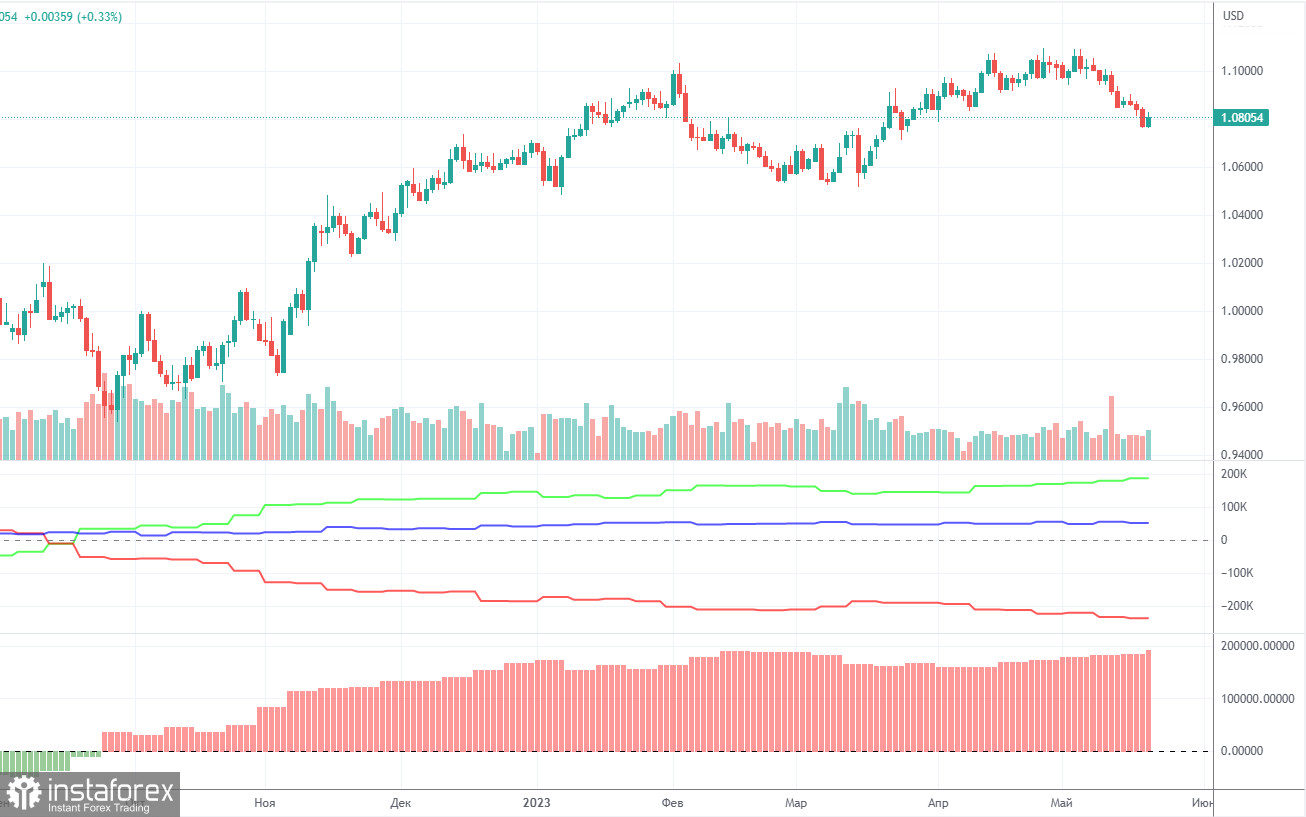
On Friday, a new COT report was released for May 16th. Over the past 9 months, the COT report data has been fully corresponding to the market situation. According to the chart, the net position of large traders (the second indicator) started to rise in September 2022. Around the same time, the European currency also began to rise. Currently, the net position of non-commercial traders, the bullish position, remains very high and continues to rise, just like the European currency itself.
We have already drawn traders' attention to the fact that a relatively high value of the net position suggests the imminent end of the uptrend. This is indicated by the first indicator, where the red and green lines are far away from each other, which often precedes the end of a trend. The euro attempted to start declining a few months ago but there was only a rebound. During the last reporting week, the number of buy contracts among the non-commercial group decreased by 1,600, while the number of short positions dropped by 9,600. Accordingly, the net position jumped again by 8,000 contracts. The number of buy contracts exceeds the number of sell contracts among non-commercial traders by 187,000 This is a very large gap. The difference is more than threefold. The correction is still looming (and perhaps already underway), so even without the COT reports, it is clear that the pair should decline.
Analysis of EUR/USD on 1H chart
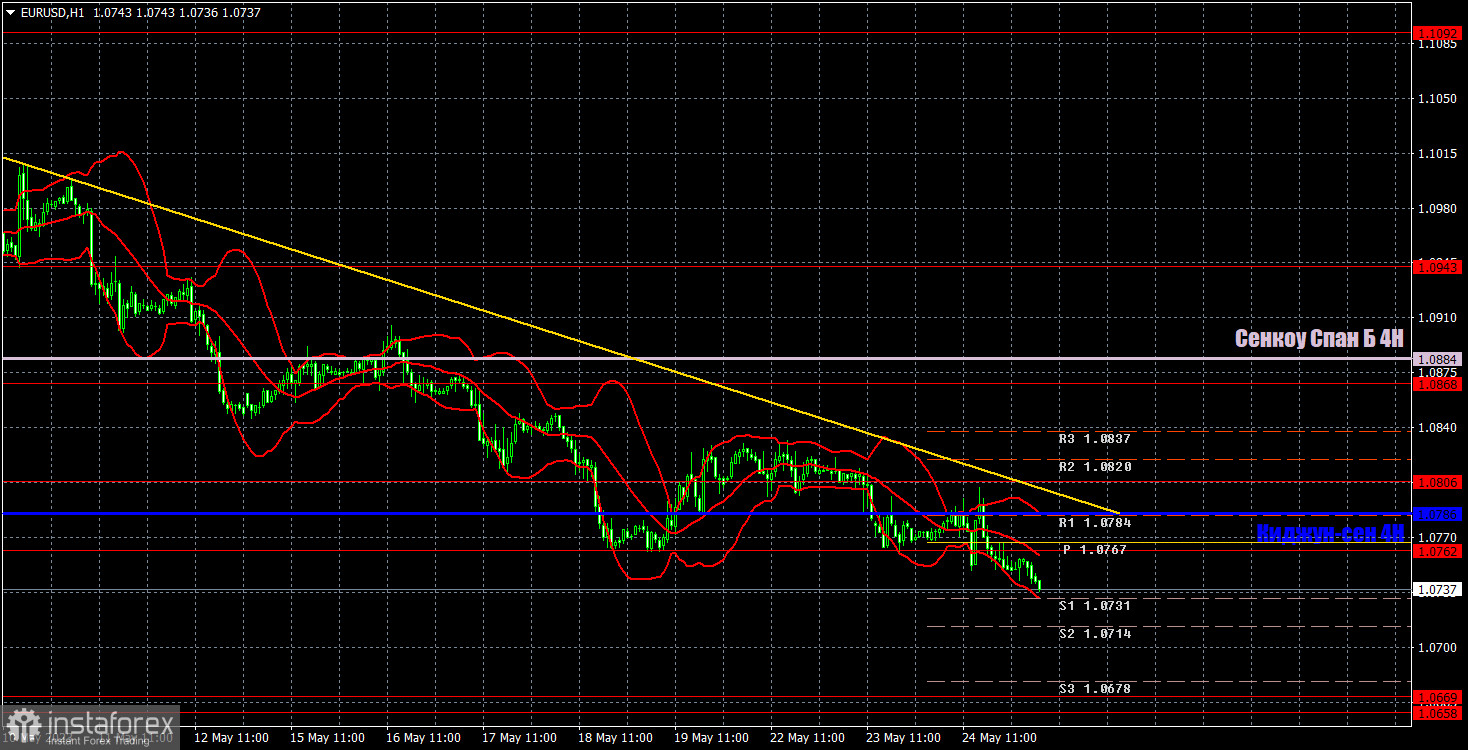
On the hourly time frame, the pair continued its downward movement, supported by the trend line. We expect a further rise in the US dollar. Consolidation above the trend line and the critical line could signal a start of a new uptrend, but in the medium term, a decline is likely to take place.
On May 25, one should pay attention to the following levels - 1.0537, 1.0581, 1.0658-1.0669, 1.0762, 1.0806, 1.0868, 1.0943, 1.1092, as well as the Senkou Span B (1.0884) and Kijun-sen (1.0786) lines. The lines of the Ichimoku indicator may move throughout the day, so this should be taken into account when determining trading signals. There are also support and resistance levels, but no signals are formed around them. Bounces and breakouts of key levels and lines can also give signals. Don't forget to set a stop loss order at breakeven if the price moves in the right direction by 15 pips. This will protect against potential losses if the signal turns out to be false.
Today, the economic calendar for the EU is empty. The US will unveil its GDP figures and initial jobless claims report. Investors will hardly take notice of the second estimate of GDP for the first quarter as well as the jobless claims report. The pair may change its trajectory only if the figures are not in line with forecasts.
What do we see on the trading chart:
Support and resistance levels (resistance/support) are thick red lines where price movement may end. They are not sources of trading signals.
Kijun-sen and Senkou Span B lines are lines of the Ichimoku indicator transferred from the 4-hour time frame to the hourly time frame. They are strong lines.
Extreme levels are thin red lines from which the price previously rebounded. They are sources of trading signals.
Yellow lines are trendlines, trend channels, and any other technical patterns.
Indicator 1 on the COT chart reflects the size of the net position for each category of traders.
Indicator 2 on the COT charts points to the size of the net position for the non-commercial group.