Analyzing Friday's trades:
EUR/USD on 1H chart
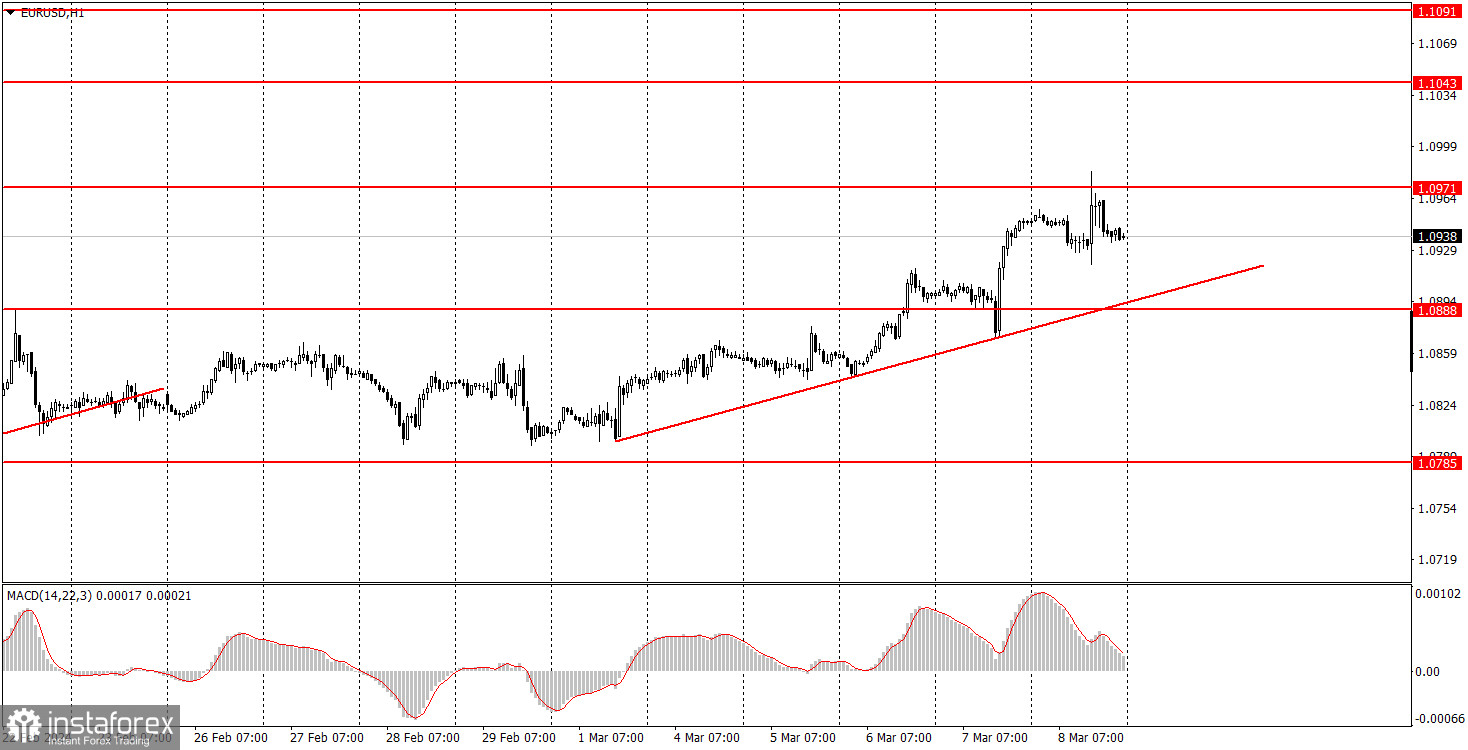
EUR/USD continued to trade higher on Friday. Unlike the previous days, the euro had a good reason to rise on Friday. In general, it all came down to two U.S. reports: NonFarm Payrolls and unemployment. And both reports fell short. The February Nonfarm Payrolls significantly exceeded forecasts, so beginners may wonder: why do we say both reports fell short? The reason is that at the same time, the January Nonfarm Payrolls figure was revised downward by more than 100,000. The unemployment rate also increased by 0.2% to 3.9%, something the market did not expect at all. Therefore, it was absolutely logical for the dollar to fall.
However, this does not mean that all of the pair's growth was logical. Apart from Friday, the euro did not have a reason to rise almost every day. Remember that Federal Reserve Chairman Jerome Powell's rhetoric cannot be considered dovish, and European Central Bank President Christine Lagarde's rhetoric is not hawkish. Other reports on the U.S. labor market were not as weak. In any case, the U.S. economy is not facing a looming recession, and the Fed may start lowering rates even later than the ECB.
EUR/USD on 5M chart
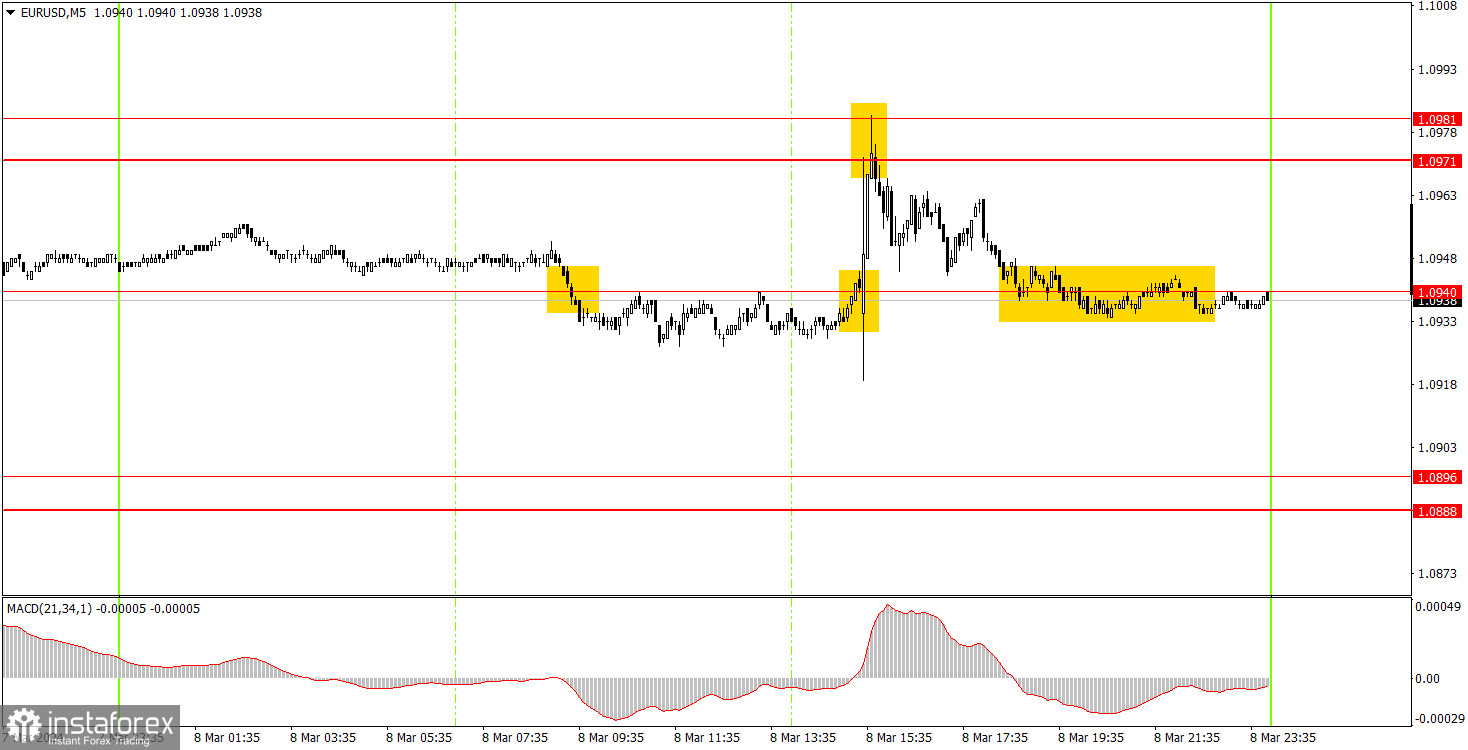
Several signals were generated on the 5-minute timeframe. In general, all the major movements were observed during the U.S. session, which is not surprising. A sell signal was formed around the level of 1.0940 during the European session, which turned out to be a false signal. But it could be closed at break even since it was better to leave the market 15 minutes before the release of U.S. data. Then the pair sharply increased and rebounded from the 1.0971-1.0981 area. You could open a short position on this signal. By the end of the day, the price managed to reach the nearest target level of 1.0940.
Trading tips on Monday:
On the hourly chart, EUR/USD left the sideways channel and appears willing to resume the upward trend, although it has no significant reason to do so. We still expect the euro to resume its decline, which, in our opinion, should continue for quite some time, but the market is not in a rush.
The key levels on the 5M chart are 1.0568, 1.0611-1.0618, 1.0668, 1.0725, 1.0785-1.0797, 1.0855, 1.0888-1.0896, 1.0940, 1.0971-1.0981, 1.1011, 1.1043, 1.1091. On Monday, there are no important reports lined up in either the European Union or the United States. There is a trendline on the hourly chart, and if the price settles below this mark, this will indicate the end of the uptrend. After that, we will consider short positions and wait for a sharp decline in the euro.
Basic trading rules:
1) Signal strength is determined by the time taken for its formation (either a bounce or level breach). A shorter formation time indicates a stronger signal.
2) If two or more trades around a certain level are initiated based on false signals, subsequent signals from that level should be disregarded.
3) In a flat market, any currency pair can produce multiple false signals or none at all. In any case, the flat trend is not the best condition for trading.
4) Trading activities are confined between the onset of the European session and mid-way through the U.S. session, after which all open trades should be manually closed.
5) On the 30-minute timeframe, trades based on MACD signals are only advisable amidst substantial volatility and an established trend, confirmed either by a trendline or trend channel.
6) If two levels lie closely together (ranging from 5 to 15 pips apart), they should be considered as a support or resistance zone.
How to read charts:
Support and Resistance price levels can serve as targets when buying or selling. You can place Take Profit levels near them.
Red lines represent channels or trend lines, depicting the current market trend and indicating the preferable trading direction.
The MACD(14,22,3) indicator, encompassing both the histogram and signal line, acts as an auxiliary tool and can also be used as a signal source.
Significant speeches and reports (always noted in the news calendar) can profoundly influence the price dynamics. Hence, trading during their release calls for heightened caution. It may be reasonable to exit the market to prevent abrupt price reversals against the prevailing trend.
Beginning traders should always remember that not every trade will yield profit. Establishing a clear strategy coupled with sound money management is the cornerstone of sustained trading success.